MT4 Line Charts
A CFD Trading chart is a graphical representation of cfd price movement of a cfd instrument over a given period of time.
Drawn on a grid and the user is at liberty to choose which cfd chart time frame they want to trade with. Cfd trader might choose to use hourly charts, daily charts or even 1 minutes chart time frames.
To draw cfd charts, three methods are used. Techniques used to draw the cfds charts defines the type of cfd trading chart.
The three types of cfd charts are: - Candlesticks Charts - Bar Charts - Line Charts
- Line charts
- Bar charts
- Candlesticks cfd charts - Most popular
MT4 Line Charts
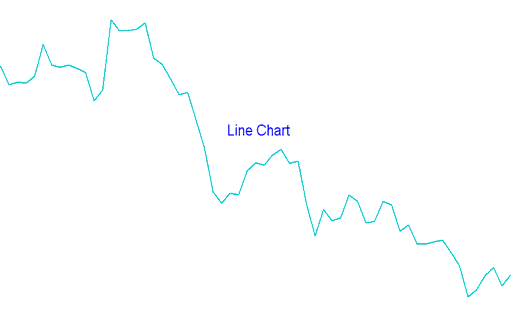
A single line is drawn from one closing cfd price to the next thus forming a continuous line.
This type of trading chart provides very little information on the chart & is therefore not very popular among cfds traders. In fact this type of cfd chart is rarely used by traders.
Line Chart in CFDs - This type of chart leaves out important data about cfd price movement. Information such as opening, high and low point of the cfd trade price which are not represented on the graph.
This makes this type of cfd line chart to be considered sketchy by cfd technical analysts.
The cfd chart below shows an example of a cfd line chart.
MT4 Bar Charts
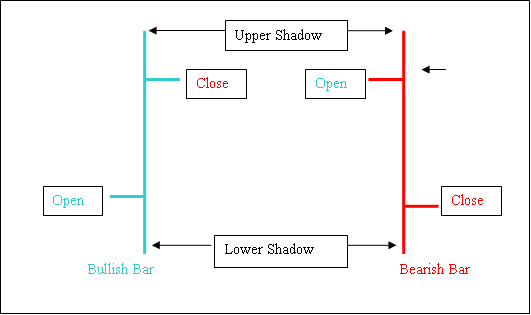
CFDs Trading Bar Charts - This type of chart shows the opening, closing, the high and the low, for a particular cfd price interval and is represented by bars that look like the ones drawn below - hence its name bar charts
- Bar Charts - bar chart has a vertical bar showing the total cfd price movement.
- Left horizontal bar the opening
- Right horizontal bar the closing
- High & low denoted by the highest and lowest point
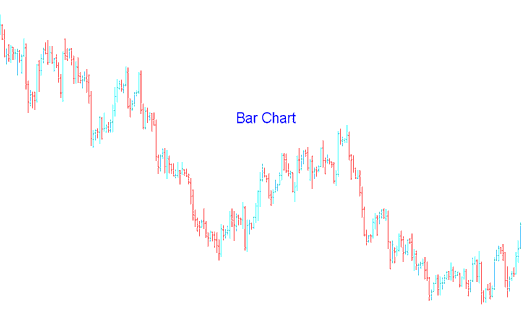
However, these cfd bar charts are not very easy to work with, especially when they aren't magnified. It becomes very hard to interpret the bar charts with ease when trading the cfds trading market thus making them not very popular among cfds traders.
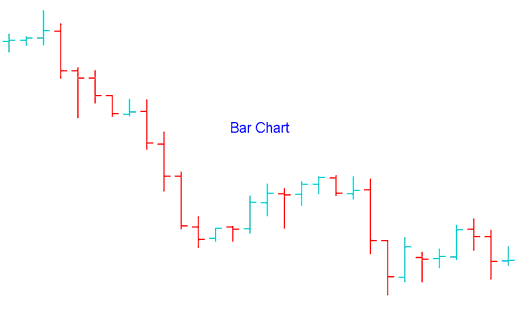
A Bar chart that is not magnified makes it hard to view the opening & closing cfd price as illustrated by this example:
MT4 Candles Charts
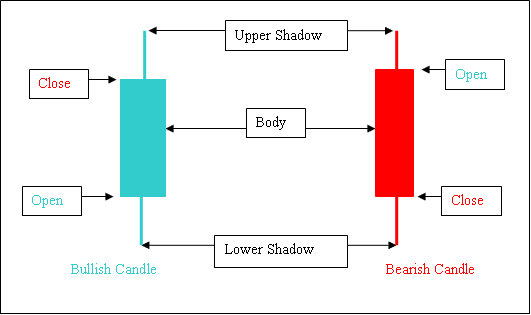
Candlesticks Charts - This is the most widely used type of cfd charts, they resemble candles, thus their name - candles charts.
Candlestick charts shows opening, closing, high and the low of a particular cfd price interval.
The range between the open cfd price & the close cfd price is known as the body of the candlestick.
CFD candlesticks charts is most popular type of cfd charts among online traders because it is easiest to interpret when trading the cfds market. CFD Trading candle charts also gives a lot of data about the cfd price movement. This makes candlesticks charts the most widely used type of charting in CFD.
Candle Sticks Charts
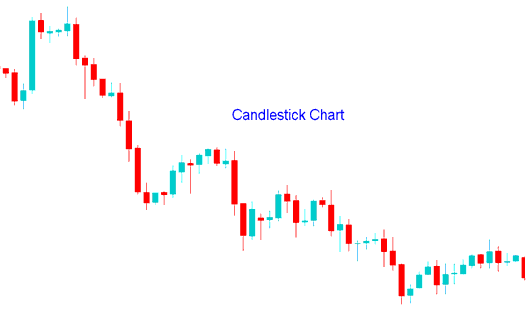
Below is an example of candlesticks charts. To learn & know more about candlesticks charts, read this topic: Technical Analysis of Japanese Candles Patterns in CFD.
How to Select These CFD Chart Types on MT4 Software
To draw any of these types of cfd trading charts on the MetaTrader 4 Platform a trader can use the buttons below found on this MetaTrader 4 platform.
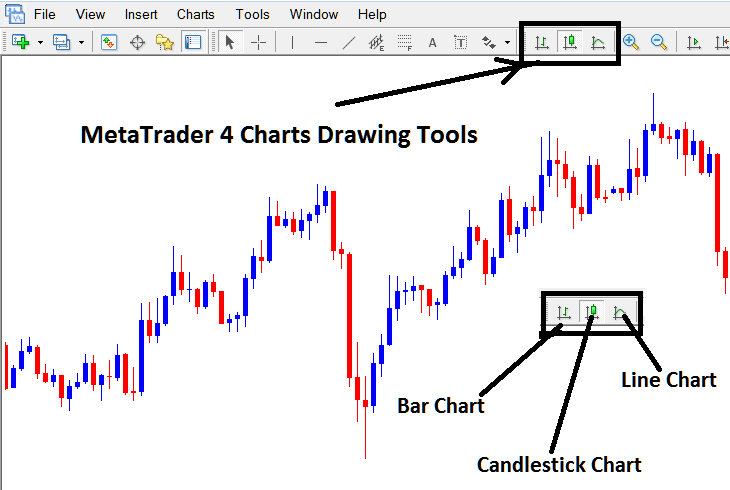
Drawing CFDs Charts on MetaTrader 4
- To Choose a Bar Chart Click the Bar Button Key
- To Select a Candles Chart Click the Candlestick Button Key
- To Choose a Line Charts - Click the Line Button


