What are Stock Price Patterns in Technical Analysis?
Stocks Price patterns in stock trading are categorized into two types of stocks price patterns and these are: Stock Patterns and Stocks Candlesticks Pattern.
Traders should learn these two different types of analysis so as to get to know how to analyze these commonly traded stocks price patterns that repeatedly keep forming on the stocks trading charts.
Introduction to Technical Analysis of Stocks Price Patterns
There are two different types of Stock Chart Technical Analysis, these two may seem similar but are not: the two are:
- Japanese Stocks Candlesticks Technical Analysis - Study of a single candlestick - Learn Japanese Candlesticks Technical Analysis
- Stock Chart Patterns Technical Analysis - Study of a series of candlesticks formations in stocks
The different topics for these two types of stocks technical analysis are: Technical Analysis
Learn Japanese Stocks Candles - Learn Stocks Technical Analysis in Stocks Trading
- Morning Star Candlesticks & Evening Star Candlesticks Stock Candlesticks Patterns Technical Analysis
Stock Patterns Guides - Learn Stocks Technical Analysis in Stock Trading
- Head & shoulders Stock Patterns & Reverse Head and shoulders Stock Chart Patterns Technical Analysis
The Technical Analysis chart examples below also illustrate the difference of the stocks price patterns of these two technical analysis methods.
Candles patterns Technical Analysis- Study of a single candle
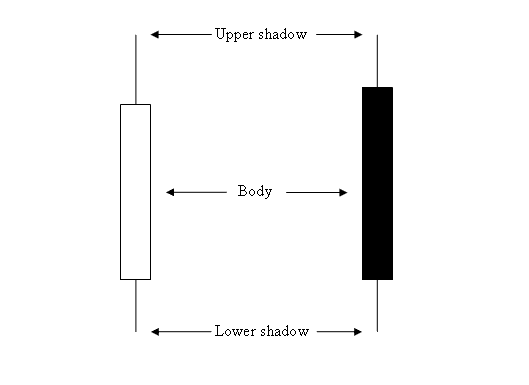
Stock Candlestick Patterns Technical Analysis - Introduction to Technical Analysis of Stocks Price Patterns
Stock Chart Patterns Technical Analysis in Stocks Trading - Study of a series of candlesticks
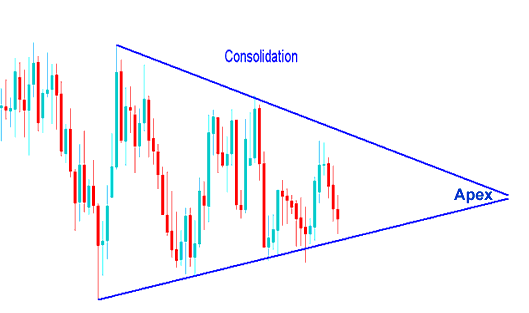
Stock Chart Patterns Technical Analysis in Stock Trading - Introduction to Technical Analysis of Stocks Price Patterns


