Inverted Hammer Candle Pattern
Inverted Hammer Bullish Stocks Candlestick Patterns
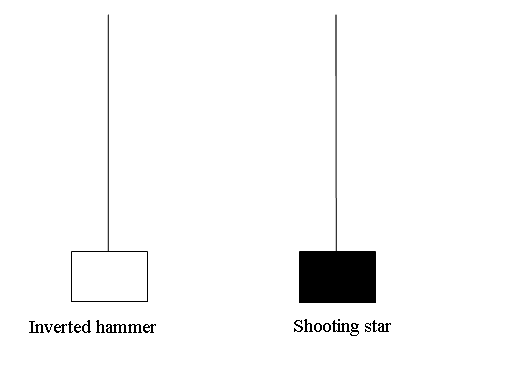
Inverted Hammer Candle Pattern & Shooting Star Candle Pattern candlesticks look alike. These have a long upper shadow and a short body at the bottom. Their color does not matter. What matters is the point where they appear whether at the top of a market stocks trend (star) or the bottom of a market stocks trend (hammer).
The difference is that inverted hammer is a bullish reversal stocks pattern while shooting star is a bearish reversal stocks pattern.
Upward Stocks Trend Reversal - Shooting Star Candlesticks
Downward Stocks Trend Reversal - Inverted Hammer Candlesticks
Inverted Hammer Candle Pattern & Shooting Star Candle Pattern Stock Chart Patterns
Inverted Hammer Stocks Candle
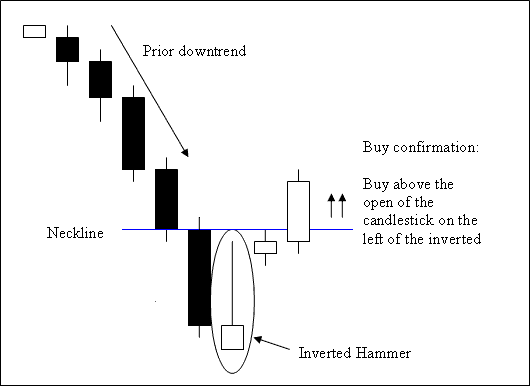
This is a bullish reversal candlestick pattern. It occurs at the bottoms of a Stocks trend.
Inverted hammer forms at the bottom of a down stocks trend and indicates the possibility of reversal of the downwards stock trend.
Inverted Hammer Stocks Candlestick
Technical Analysis of Inverted Hammer Stocks Candle
A buy is completed when a candle stick closes above the neckline, this is opening of the candle stick on the left side of this pattern. The neck line level in this acts as a resistance zone.
Stop orders for the buy stock trades should be placed a few pips below the lowest stocks price on the recent low.
An inverted hammer is named so because it signifies that the stocks market is hammering out a bottom.
Shooting Star Candlestick
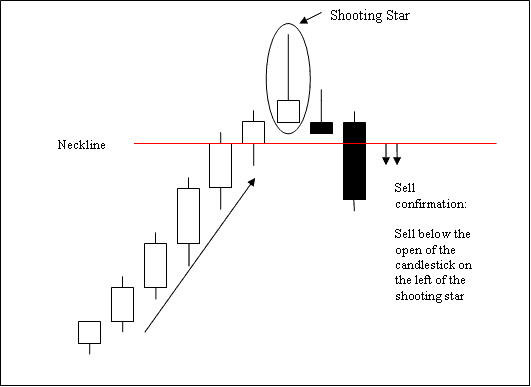
This is a bearish reversal candle pattern. It forms at the tops of a market trend.
It occurs at the top of an up stocks trend where the open stocks price is the same as the low & stocks price then rallied up but was pushed back downwards to close near the open.
Shooting Star Candle
Technical Analysis of Shooting Star Candlestick
A sell is completed when a candle stick closes below the neckline, this is opening of the candle stick on the left side of this pattern. The neckline in this case is a support level.
Stop orders for the sell stock trades should be placed a few pips above the highest stocks price on the recent high.
The Shooting Star is named so because at the top of an upwards market stocks trend this stocks candlestick pattern resembles a shooting star up in the sky.


