How Do I Analyze Piercing Line Stocks Candlesticks Pattern?
Piercing Line stocks candlesticks pattern is a long black body followed by a long white body candle.
The white body pierces the mid point of the prior black body.
Piercing Line stocks candle-sticks pattern is a bullish reversal stocks pattern that forms at the bottom of a market downward stock trend. It shows that the stocks market opens lower and closes above the midpoint of the black body.
Piercing Line candlesticks pattern shows that the momentum of the downward stocks trend is reducing and stock trading market trend is likely to reverse and move in an upwards direction.
Piercing Line candles pattern is shown known as a piercing line signifying the stocks market is piercing the bottom showing a market floor for the stocks price downwards trend.
How Do You Analyze Piercing Line Stocks Candles Pattern?
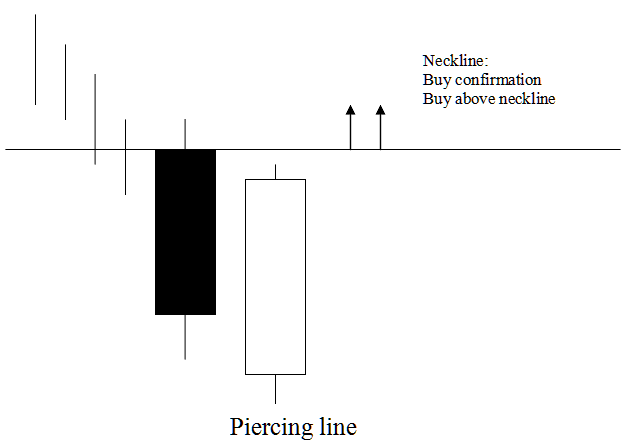
Technical Analysis Piercing Line Candlestick - Stocks Candles Pattern
A bullish reversal buy signal is completed once stocks price closes above the neck line region which is the opening of the candlestick on the left side of the Piercing Line candle.
Piercing Line candle pattern is a stocks candle-sticks pattern which is bullish & stocks price should continue moving upward and for a trader who puts a buy stocks trade should place a stop-loss order just below the lowest stocks price region.


