How Do I Analyze Double Top Chart Pattern?
A double top chart pattern is a bearish stocks trend reversal signal that signals the current upwards stocks market is about to reverse once the double tops chart pattern is completed.
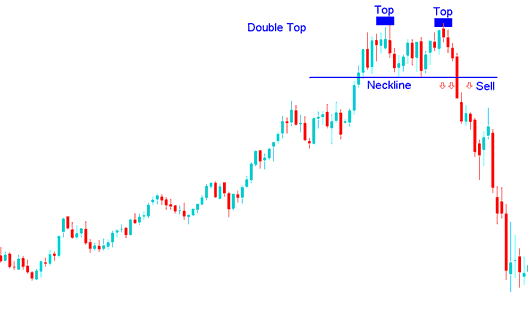
The double tops chart pattern is a pattern with two consecutive peaks where the second peak is slightly lower than the first peak which is interpreted that the upwards stocks trend is losing momentum & if stocks price of the stocks falls below the support level which is the low between the 2 peaks then the double tops pattern is considered to be confirmed & the stocks price of the stocks changes to a bearish stocks trend.
How Do You Analyze Double Top Chart Pattern? - How Do I Analyze Double Tops Chart Pattern?


