How Do I Analyze Hammer Candlesticks Pattern?
Hammer candle stick pattern is a potentially bullish candle stick pattern which forms during a downward stock trend. It is named so because the stocks market is hammering out a market bottoms.
A hammer candle-stick pattern has:
- A small body
- The body is at the top
- The lower shadow is two or three times length of the real body.
- Has no upper shadow or very small upper shadow if present.
- The color of the body isn't important
How Do You Analyze Hammer Candles Pattern?
Technical Analysis of Hammer Candlesticks Pattern
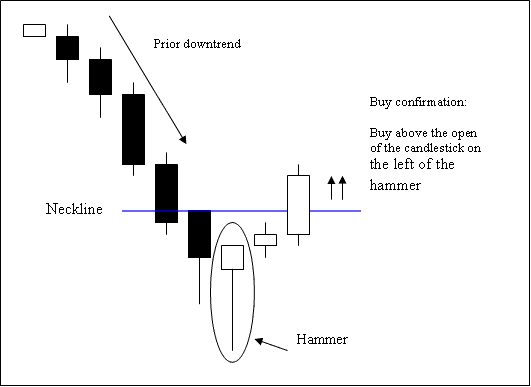
The bullish reversal buy signal is confirmed when a candlestick closes above the opening stocks price of the candlestick on the left side of the hammer candlestick pattern.
Stop Loss orders should be placed a few pips just below the low of the hammer candle stick once a trade is opened using this candles pattern formation.


