
MACD Cross-over Signals
MACD center line cross-overs create signals using the centerline mark, and the market's feeling can be confirmed using the MACD center line crossovers.
When the MACD crosses above the centerline, it signals bullish sentiment. A cross below the centerline means bearish sentiment.
- When Fast-line crosses below the MACD Line (not center line) it shows market momentum is slowing - this is not a reversal signal or a sell signal, wait out for center line mark cross over.
- When the Fast-line crosses above MACD Line (not center mark) it shows the market momentum is slowing - this isn't a reversal signal or a buy Stock Index signal, wait out for center line mark crossover.
- The Center-Line crossover signals will be the best signals for confirming buy & sell signals.
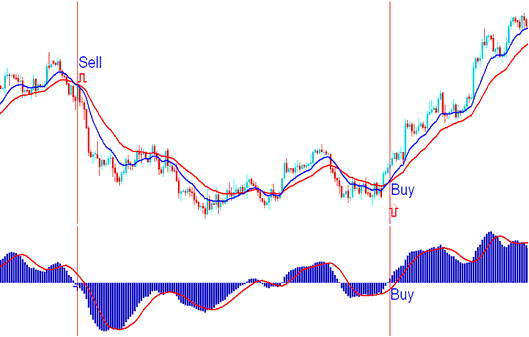
Referring to the example chart provided, a confirmed sell signal was generated when the faster MACD line crossed beneath the central zero line, indicating a shift in market sentiment towards a bearish, downward trend.
Furthermore, in the accompanying illustration, a buy Stock Index signal was triggered when the MACD fast line subsequently crossed above the zero centerline, signaling a shift in market sentiment towards bullishness - an upward direction.
MACD Zero-Line Crossover Analysis - Pinpointing the Exact Moments of Sell and Buy Signal Generation
Oscillation of the MACD Indicator
The MACD indicator is an oscillating indicator, moving up and down around a center point of zero. The center is the point of neutral reading, and values above zero show that the market trend is positive, while values below zero show that the market trend is negative.
The MACD indicator spots overbought and oversold levels too. When MACD hits extreme points, the index looks overbought or oversold. In a strong uptrend, prices stay overbought. So buy the stock index in that case.
In a strong downward trending Index market, it's better to sell because prices tend to stay low for an extended period in the over-sold area.
Overbought conditions are identified when the indicator is significantly above the zero line, whereas oversold conditions occur substantially below it.
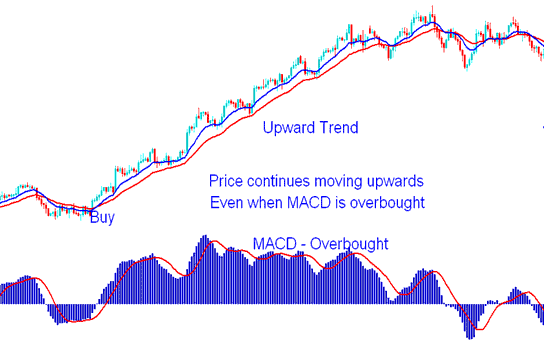
MACD Overbought Region - Indices Trend Continuation Signal
Examine More Subjects & Educations:
- List of WallStreet 30 Strategy
- What is S&P 500 Spreads? S&P500 Indices Spread
- MT4 Gold Margin Level Calculation
- Course to Trade UK 100 Stock Index
- How to Put the IBEX35 Index on MetaTrader 5 Software
- How to Add Ultimate Oscillator to MT4 Charts Explained
- Which are The Major Forex Pairs Definition Explained