Types of Bullish Stock Indices Trading Divergence Stock Indices Setups
Types of Stock Indices Trading Divergence Definition - Divergence is a stock indices setup used by Stock Indices traders - Stock Indices Trading Divergence Stock Indices Setups involves looking at a stock indices chart & a stock indices indicator - for example MACD indicator.
To find this Stock Indices Trading Divergence Stock Indices Setups setup find 2 chart points which stock index price makes a new swing high or a new swing low but the MACD indicator does not do the same, this stock indices signals a divergence between stock index price & MACD technical indicator momentum.
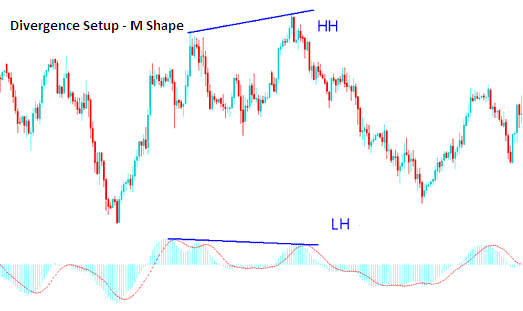
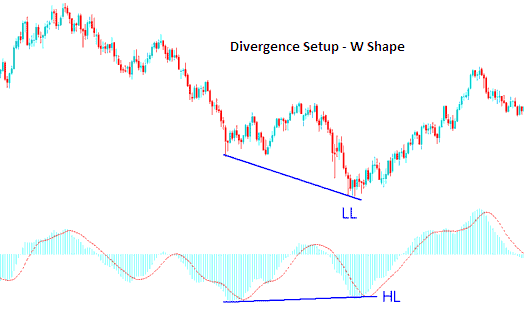
For a Stock Indices Trading Divergence Stock Indices Setups setup we look for 2 chart points, 2 highs which form an M shape on the stock index chart or two lows that form a WShape on the stock index chart. Then look for the same M shape or W Shape on the Stock Indices Trading MACD indicator.
Example of a Indices Trading Divergence Trade Setup:
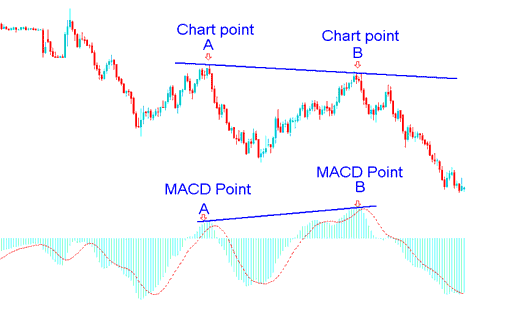
In the stock indices chart below we spot 2 chart points, point A & point B (swing highs). These 2 chart points form an M shape on the stock index price chart.
Then using stock indices trading MACD technical indicator we check the highs made by the MACD stock index technical technical indicator, these are highs which are direct below Chart points marked A & B.
We then draw one line on the stock index chart & another line on the MACD technical indicator.
Stock Indices Trading Divergence Stock Indices Setups Signals - Types of Stock Indices Trading Divergence Explanation - Types of Stock Indices Divergence Definition
The stock indices chart above shows example of hidden bearish Stock Indices Trading Divergence setup.
hat is Stock Indices Trading Divergence Stock Indices Setups Types of Stock Indices Trading Divergence
In order to trade Stock Indices Trading Divergence Stock Indices Setups trading signal we look for the following:
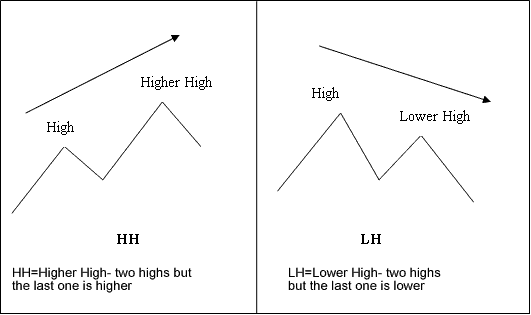
- HH : Higher High - 2 highs but the last one is higher
- LH : Lower High - two highs but the last one is lower
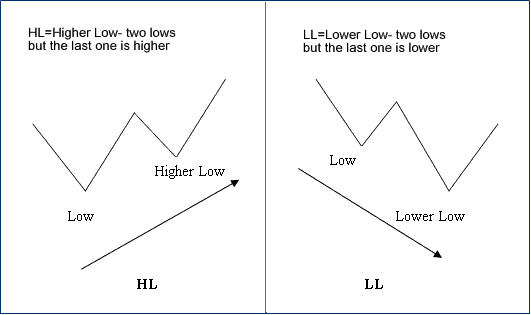
- HL : Higher Low - 2 lows but the last one is higher
- LL : Lower Low - two lows but the last one is lower
Stock Indices Trading Divergence Stock Indices Setups Terms Definition: Different Types of Stock Indices Trading Divergence Stock Indices Setups - Types of Stock Indices Trading Divergence
M shapes on Stock Indices charts dealing with Indices price Highs
W Shapes on Stock Indices charts dealing with Indices price lows
Example of M Shapes on Stock Index Charts - Types of Bearish Stock Indices Trading Divergence Stock Indices Setups
Examples of W Shapes on Stock Index Charts - Types of Bearish Stock Indices Trading Divergence Stock Indices Setups
Types of Stock Indices Trading Divergence - Types of Bearish Stock Indices Trading Divergence Stock Indices Setups - Types of Bullish Stock Indices Trading Divergence Stock Indices Setups - Types of Stock Indices Trading Divergence Explanation - Types of Stock Indices Divergence Definition


