Best Bollinger Bands Settings for Stock Index Day Trading
Adding MT4 Bollinger Bands Indicator
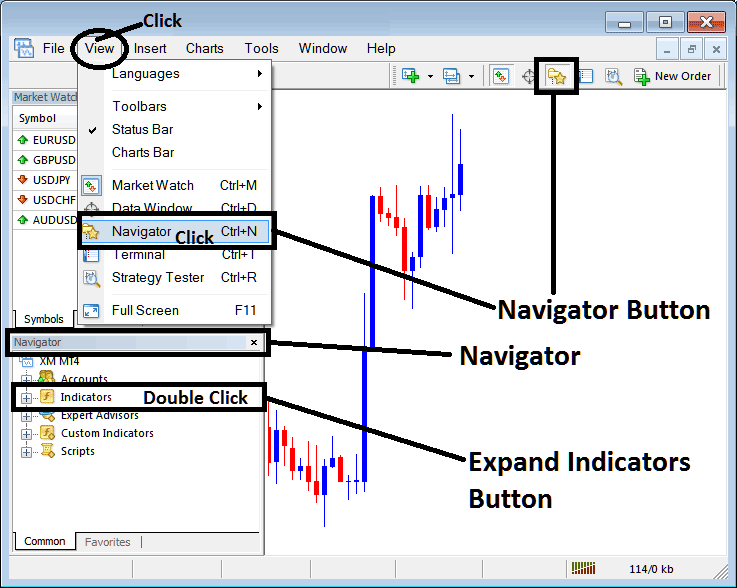
Step 1: Open MT4 Software Navigator Window
Open MetaTrader 4 Navigator window as shown below: Go to 'View' menu (click), then choose the 'Navigator' window (click), or From Standard Tool Bar click the 'Navigator' button or use keyboard short cut keys 'Ctrl+N'
On MT4 Navigator panel, choose "Technical Indicators", (DoubleClick)
Best Bollinger Band Setting for 1 Hour Stock Index Chart - Best Bollinger Bands Settings for 4 H Stock Index Chart
Adding Bollinger Bands MT4 Indicator
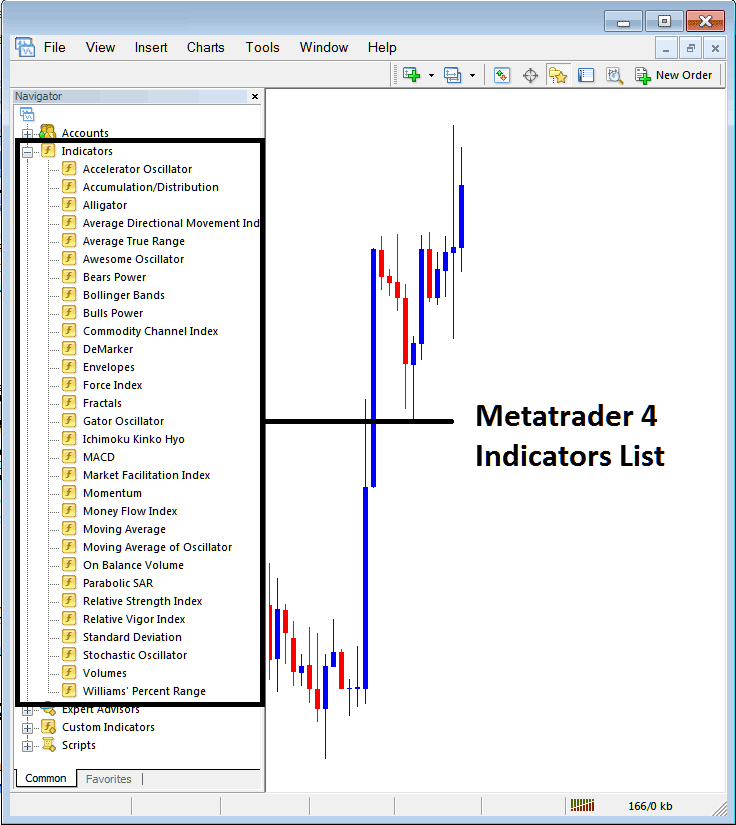
Expand the menu by clicking the expand button marker (+) or double click the 'indicators' menu, after this the button will appear as (-) and will now display a list as shown below - select the Bollinger Bands indicator from this list of stock indices indicators so as to add the Bollinger Bands indicator on the stock index chart.
Best Bollinger Band Setting for 1 Hour Stock Index Chart - Best Bollinger Bands Settings for 4 H Stock Index Chart
How to Install Bollinger Bands Stock Index Indicator MT4
If the technical indicator you want to add is a custom Bollinger Bands indicator - for example if the Bollinger Bands technical indicator you want to add is a custom indicator you will need to first add this custom Bollinger Bands indicator on the MT4 platform & then compile custom Bollinger Bands indicator so that the newly added Bollinger Bands custom stock indices indicator pops up on the listing of custom stock indices indicators on the MT4 software.
To learn how to install Bollinger Bands indicator on MetaTrader 4, how to add Bollinger Bands indicator panel to MetaTrader 4 & how to add Bollinger Bands indices custom MT4 indicator on MetaTrader 4 - How to add a custom Bollinger Band stock indices indicator on MetaTrader 4.
About Bollinger Bands Stock Indices Technical Indicator Guide
Indices Trading Bollinger Band Technical Analysis & Bollinger Bands Trading Signals
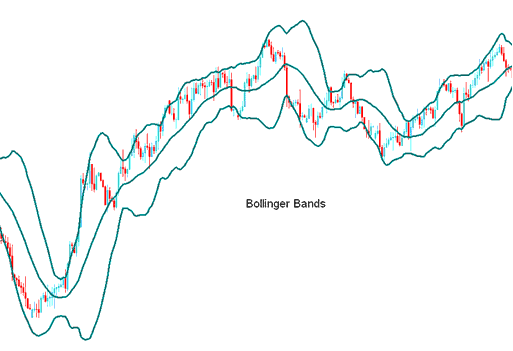
Bollinger bands are made up of 3 lines. Middle line is a Moving Average - 20 stock index price period Simple Moving Average.
Bollinger bands indicators are then drawn at a distance away from the moving average technical indicator. These are bands which form the lower and upper lines.
The distance where the bands are drawn is decided by another indicator called the standard deviations. Standard deviation is a measure of stock index price volatility in the stock index trading market.
Since the stock index price volatility keeps on changing, the standard deviations will keep varying, & since Bollinger bands are drawn using the standard deviations the distance of the Bollinger bands will keep on adjusting themselves to the stock indices market volatility.
When the stock index price becomes more volatile, the Bollinger Bands indicators widen - Bollinger Bands contract during the less volatile periods.
The 3 Bollinger Bands are designed to encompass the majority of a stock index price action movement. Middle Bollinger Band forms the basis for the stock index price trend, typically a 20 stock index price period simple moving average.
This middle Bollinger Band also serves as the base for the upper and lower Bollinger Bands. The upper Bollinger band's and lower Bollinger band's distance from the middle Bollinger band is determined by stock index market price volatility. The upper band of this indicator is drawn at +2 standard deviations above the middle Bollinger Band while the lower band is drawn at -2 standard deviations below the middle Bollinger Band.
Best Bollinger Band Setting for 1 Hour Stock Index Chart - Best Bollinger Bands Settings for 4 H Stock Index Chart
Indices Trading Bollinger Band Technical Analysis & How to Generate Stock Indices Trading Bollinger Band Signals
- Bollinger Bands provide a relative definition of high & low of index price
- Bollinger Bands are used to spot periods of high & low volatility
- Bollinger Bands are used to spot periods when prices are at extreme areas
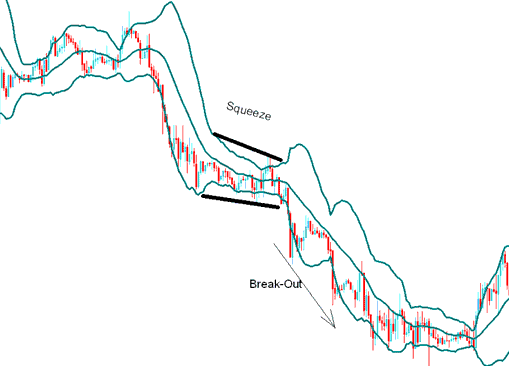
the Bollinger Bands Squeeze
The Bollinger Band tighten as volatility lessens, this identifies the periods of stock index price consolidation. Sharp stock index price breakouts tend to occur after the Bollinger Bands indicators tighten.
Best Bollinger Band Setting for Stock Index Swing Trading - Best Bollinger Bands for Scalping Stock Index
the Bollinger Band Bulge
If stock index prices break through the upper or lower Bollinger Bands indicator & move outside the Bollinger Bands a continuation of the current stock index price trend is expected.
Best Bollinger Band Setting for Stock Index Swing Trading - Best Bollinger Bands for Scalping Stock Index
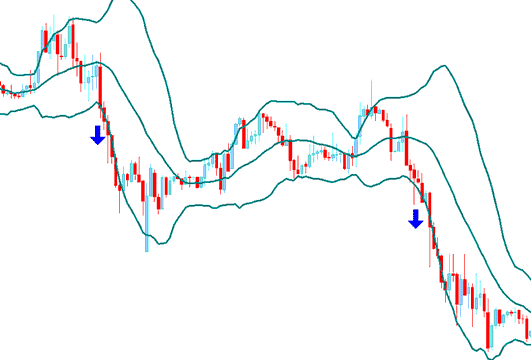
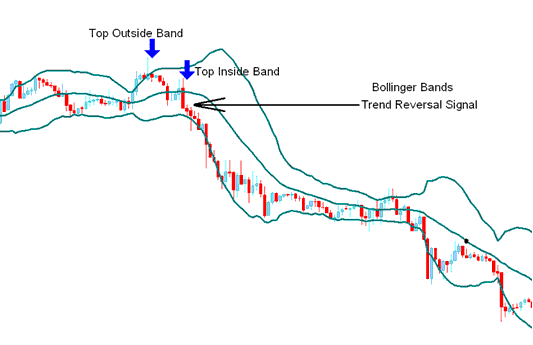
Bollinger Bands Double Top and Double Bottoms
Bottoms and tops made outside the Bollinger Bands followed by bottoms & tops made inside the Bollinger Bands signals for stock indices trading reversals in the stock index price trend
Bollinger Band Whipsaw
Traders should be on the look out for false break-outs known as Bollinger Bands whipsaws or Bollinger Bands head fakes.
Best Bollinger Band Setting for Stock Index Swing Trading - Best Bollinger Bands for Scalping Stock Index
Indices Price often breaks out in one direction immediately following the Bollinger Bands Squeeze causing many traders to think the stock index price breakout will continue in that direction, only for stock index price to quickly reverse and make the true and more significant stock index price breakout in opposite direction.
Traders acting quickly on the initial stock index price breakout often get caught on the wrong side of the stock index price action - while those traders expecting a "false break-out" can quickly close-out their original stock indices trade positions and enter a trade in direction of the stock index price reversal. It's always good to combine Bollinger bands indicator with other confirmation stock index technical indicators.
Best Bollinger Band Setting for 1 Hour Stock Index Chart - Best Bollinger Bands Settings for 4 H Stock Index Chart - Best Bollinger Bands Setting for Stock Index Day Trading - Best Bollinger Bands Setting for Stock Index Swing Trading - Best Bollinger Bands for Scalping Stock Index


