Day Indices Trading Using 1 H Indices Trading Chart
To create a 1 Hour Day Trading Strategy that generates the stock indices signals on the H Stock Indices Chart shown below - Day Trading 1 Hour Chart - Day Trading Using the 1 H Chart. We shall use 1 Hour stock index chart to write the rules of this stock indices strategy - 1 Hour Day Trading Strategy.
This 1 Hour Day Strategy refers to a set of written stock index rules that you as a stock indices swing trader follows to manage your trades on the 1 Hour Stock Indices Charts. These stock indices strategy rules must be written down so as to tutorial you. This learn stock indices strategy guide will explain how to write down the rules of your stock indices trading strategy.
The keyword is a SET OF RULES which you must follow when trading. If you don't follow the stock indices rules of your stock indices strategy then you do not have a Stock Indices Trading Strategy. Stock Indices Trading strategies must have rules which are written down within your stock index trading plan.
Examples of 1 Hour Day Trading Strategy below:
Writing Rules of a 1 H Day Strategy - Day Trading 1 H Chart - Day Trading Using the 1 Hour Chart
You can create the above 1 H Day Trading Strategy using the steps below:
Step 1:Step 2:Choose Your Stock Indices Chart Time-frame - 1 H Stock Indices Chart
Step 3:Choose Indices Technical Indicators which Identify a New Stock Indices Trend - Moving Average Crossover Strategy.
Step 4:Choose Indices Indicators that Confirm the Stock Indices Trend - RSI Technical Indicator, Stochastic Indicator
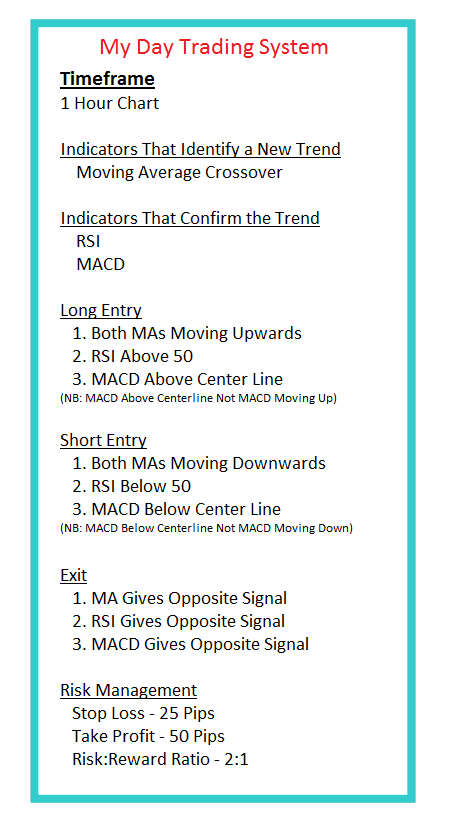
Step 5:Define Entry & Exit Points
Buy Entry
- Both Moving Averages pointing up
- RSI indicator above 50
- Stochastic oscillator heading up
Sell Entry
- Both Moving Averages pointing down
- RSI indicator below 50
- Stochastic oscillator heading down
Exit Trading Signal
- Moving Averages technical indicators gives opposite trading signal
- RSI indicator gives opposite trading signal
Step 6:Calculating risks in each trade - Select the number of Pips to set for the indices stop loss order for your open stock indices trades
Step 7:
Test the 1 H Day Trading Strategy on a practice stock indices practice account
After using these stock indices step by step guide you can create written 1 Hour Day Trading Strategy Rules as displayed and illustrated below.
Writing 1 H Day Trading Strategy Stock Indices Trading Rules
Example of How to Write the Best 1 H Day Trading Strategy Rules
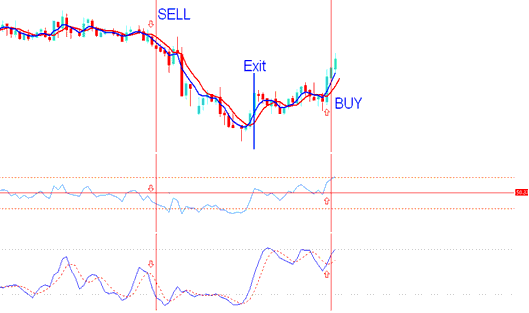
This 1 H Day Trading Strategy produces the stock indices signals as shown below. Using these stock indices strategy rules - traders can determine when to enter and exit trades.
1 Hour Day Trading Strategy - 1 Hour Chart Day Trading Strategy - 1 Hour Candlestick Break out Strategy
We have completed writing the stock indices rules, if you are researching on how to create the best 1 Hour Stock Indices strategy - this learn stock indices strategy tutorial is a good guide - you can also include the 1 Hour Day Trading Strategy Rules in your Stock Indices Trading Plan.
1 Hour Day Trading Strategy - 1 Hour Chart Day Strategy - H1 Breakout Strategy - Day Trading 1 Hour Chart


