Best MACD Settings for Stock Index Day Trading
Adding MetaTrader 4 MACD Indicator
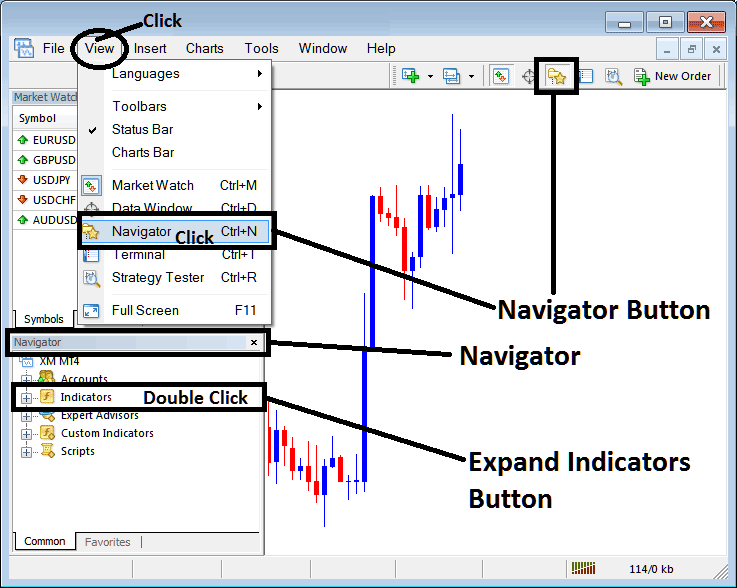
Step 1: Open MT4 Software Navigator Window Panel
Open MetaTrader 4 Navigator window as shown below: Go to "View" menu (click), then choose the "Navigator" window (click), or From the Standard Tool-bar click on the "Navigator" button key or use keyboard short cut keys "Ctrl +N"
On MetaTrader 4 Navigator panel, select "Technical Indicators", (DoubleClick)
Best MACD Setting for H4 Stock Index Chart - Best MACD Setting for Stock Index Day Trading
Adding MACD MetaTrader 4 Stock Index Chart Indicator
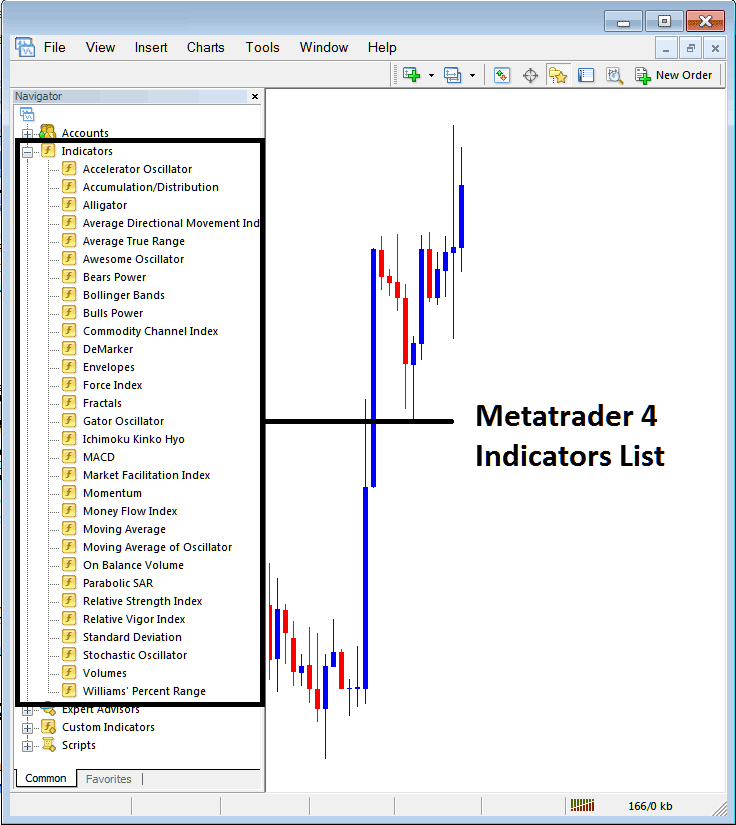
Expand the index technical trading indicators popup menu by clicking the expand button marker (+) or double click the "indicators" menu, after this the button will appear as (-) and will now display a list as shown below - select the MACD indicator from this list of stock indices trading MT4 indicators so as to add the MACD indicator on the stock index chart.
Best MACD Setting for H4 Stock Index Chart - Best MACD Setting for Stock Index Day Trading
How to Install MT4 MACD Indicator
If the technical indicator you want to add is a custom MACD indicator - for examples if the MACD indicator you want to add is a MACD custom MT4 indicator you will need to first add this custom MACD indicator on the MetaTrader 4 platform & then compile custom stock indices trading MACD technical indicator so that the new added MACD custom stock indices indicator appears on the listing of custom stock index indicators in MetaTrader 4 software.
To learn how to install MACD indicator on MetaTrader 4, how to add MACD indicator panel to MT4 & how to add stock indices trading MACD custom MT4 indicator on MetaTrader 4 - How to add a custom MACD indicator on MetaTrader 4.
About MACD Indices Trading Indicator Tutorial
MACD Stock Indices Trading Analysis & MACD Trading Signals
The MACD technical indicator is one of the simplest, reliable, and most oftenly used stock index technical indicators.
MACD is a momentum oscillator and also a stock index trading price trend following indicator.
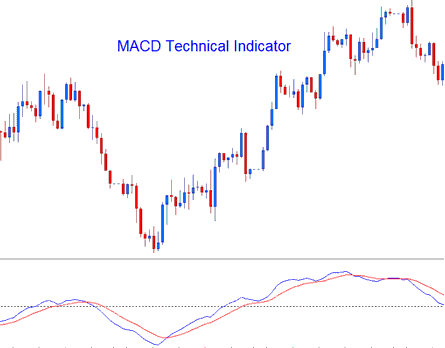
Construction of MACD Indicator
Construction of this MACD indicator calculates the difference between two moving averages and then draws that as "Fast" line: the a second "Signal" line is then calculated from resulting "Fast" line & then plotted on same panel window as "Fast" line.
- "Fast" line - Blue Line
- "Signal" line - Red Line
The "standard" MACD indicator values for "Fast" line is a 12-period exponential moving average & a 26-period exponential moving average and a 9-period exponential moving applied to the fast line, this plots "Signal" line.
- MACD Fast-line - difference between 12 & 26 exponential moving averages
- MACD Signal Line - moving average of this difference of 9 - periods
Best MACD Setting for Stock Index Swing Trading - Best MACD Settings for Scalping Stock Index - Best MACD Settings for Stock Indices
MACD Indices Trading Analysis and How to Generate Stock Indices Trading MACD Trading Signals
The MACD indicator is a commonly used as stock index trading price trend following indicator & works most effectively when analyzing stock index trading price trending stock index trading price movements. The three common strategies of using MACD indicator to generate stock indices trading signals are:
Crossovers Indices Trading Signals:
MACD Fast-line, MACD Signal Line Crossover:
- A buy signal gets generated when the MACD Fast line crosses above the MACD Signal line
- A sell trading signal is generated when MACD FastLine crosses below the MACD Signal Line.
However, in a strong stock index trading price trending market this signal gives a lot of whipsaws, the best stock indices trading MACD crossover to use would thus be the MACD Zero Line Crossover Signal that's less prone to stock indices trading whipsaws.
MACD Zero Line Crossover Signals:
- When the MACD FastLine crosses above MACD zero center line a buy stock index trade signal is generated.
- when the MACD FastLine crosses below the MACD zero center line a sell stock index trade signal is generated.
MACD Divergence Stock Indices:
Looking for divergences between the MACD indicator & stock index trading price can prove to be very effective in spotting potential stock index trading price trend reversal and/or stock index trading price trend continuation points in stock index trading price movement. There 2 types of MACD divergences:
- MACD Classic Divergence Trading Signals
- MACD Hidden Divergence Trading Signals
MACD Overbought Indices Trading Levels & MACD Oversold Stock Indices Trading Levels:
MACD indicator is also used to identify potential overbought & oversold levels in stock index price action movements.
These overbought and oversold levels are generated if the shorter MACD Lines separate dramatically from the median, this is a signal that stock index price action is over extending and price will soon return back to more realistic regions.
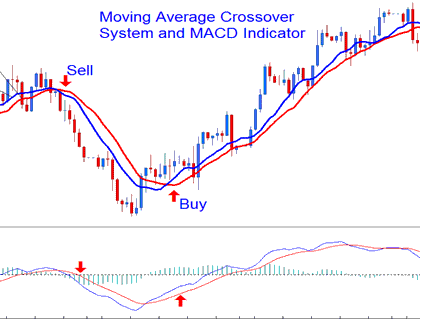
MACD & Moving Average Crossover Indices System
MACD technical indicator can be combined with other indicators to form a stock index system. A good MACD indicator combination is with the Moving Average cross over stock indices system. A stock indices signal is generated when both stock indices technical indicators give a trading signal in same direction.
Best MACD Setting for Stock Index Swing Trading - Best MACD Settings for Scalping Stock Index - Best MACD Settings for Stock Indices


