What are Trend Lines Forex Signals? - What Do Forex Trend Lines Signals Mean?
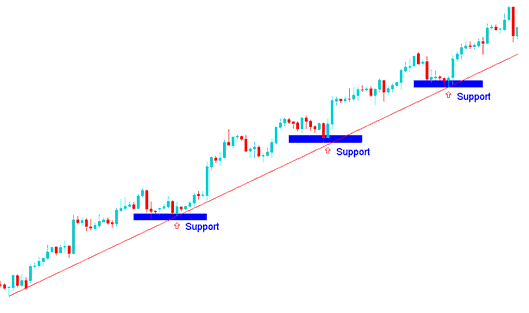
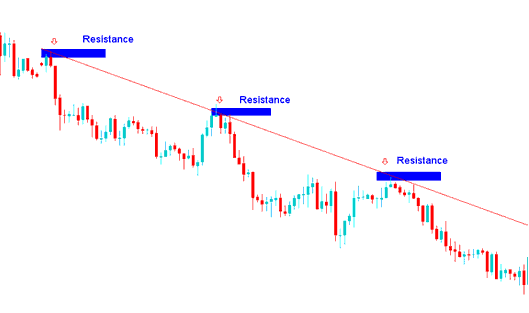
A trendline on a forex chart is used to indicate the general direction of the forex prices - upwards or downwards.
Forex trendline signals are when the price touches the trend line - when the price touches the trend line then this is interpreted as buy signal or a sell signal
When price touches the upward trend line it means this is a buy signal and forex traders will use this upwards trend line point to open buy trades. The trades are then held open as long as the prices remain above the upwards trend.
What are Trend lines Signals? - What are Trend lines Forex Signals? - What Do Forex Trend Lines Signals Mean?
When price touches the downward trend line it means this is a sell signal and forex traders will use this downward trend line point to open sell trades. The trades are then held open as long as the prices remain below the downward forex trend.
What are Trend lines Signals? - What are Trend lines Forex Signals? - What Do Forex Trend Lines Signals Mean?


