What is Bollinger Bands? - Fibonacci Ratios Indicator Forex Buy Signal and Sell Signal
Bollinger Bands - Fibonacci Ratios Indicator Buy Signal
How to Generate Forex Buy Signal Using Bollinger Bands - Fibonacci Ratios Indicator
Steps on how to generate forex buy signals using Bollinger Bands - Fibonacci Ratios forex indicator:
This Bollinger Bands - Fibonacci Ratios forex indicator buy signal tutorial explains how to generate forex buy signals using the Bollinger Bands - Fibonacci Ratios forex indicator as shown below:
How to Generate Forex Buy Signals Using Bollinger Bands - Fibonacci Ratios Indicator
Bollinger Band - Forex Fib Ratios Indicator Sell Forex Signal
How to Generate Forex Sell Signal Using Bollinger Bands - Fibonacci Ratios Technical Indicator
Steps on how to generate forex sell signals using Bollinger Bands - Fibonacci Ratios forex indicator:
This Bollinger Bands - Fibonacci Ratios forex indicator sell signal tutorial explains how to generate forex sell signals using the Bollinger Bands - Fibonacci Ratios forex indicator as shown below:
How to Generate Forex Sell Signals Using Bollinger Bands - Fibonacci Ratios Indicator
FX Technical Analysis & How to Generate Signals
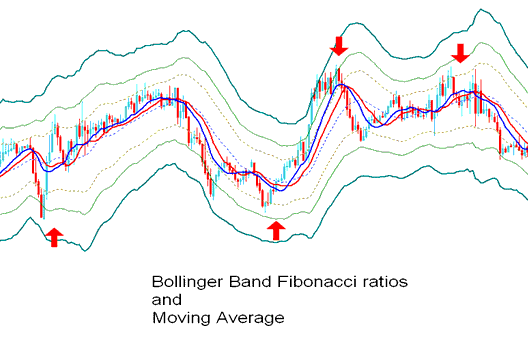
This indicator used to determine point of support and resistance for a currency pair.
Lines below represent support points while those above are resistance zones.
The outermost bands provide the strongest resistance/support.
The inner most bands provide least support/resistance.
The innermost band represents Fibo 38.2% retracement level
The second band represents Fib 50% retracement level
The outermost band represents Fib 61.80% retracement level
The Indicator is used to determine points where price might reverse. (Price Pullback Levels)
When price hits one of the lines & reverses then an entry or exit signal is generated.
However, it's always good to combine the signal with other confirmation indicators such as the moving average to confirm the signal as shown below.
Technical Analysis in FX Trading
What is Bollinger Bands - Fibonacci Ratios Indicator Forex Buy Signal and Sell Signal?


