McGinley Dynamic Technical Analysis & McGinley Dynamic Signals
Developed by John McGinley
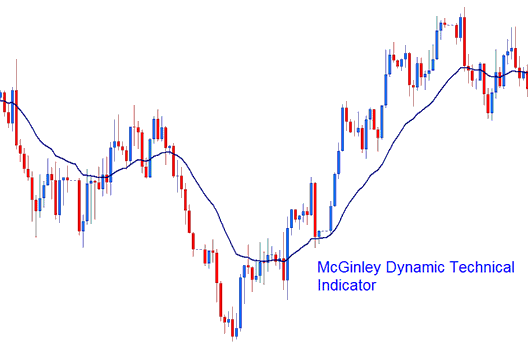
McGinley Dynamic aims to overcome the lag of the traditional simple and exponential moving averages, the indicator automatically adjusting itself relative to the speed of the FX market. Thus its name, dynamic.
The indicator follows price movements closely in both a fast and a slow moving forex market.
Forex Technical Analysis & How to Generate Signals
This technical indicator is better at avoiding whip-saws compared to the original moving average.
Calculated using the formula:
Dynamic = D1 + (Price - D1) / (N * (Price/D1)^4)
D1 = previous value of Dynamic technical indicator
N = smoothing factor (of price periods)
^ = Power of
Bullish, Buy Forex Signals and Bearish, Sell FX Signals
McGinley Dynamic should be combined with moving averages to form a Forex trading system. McGinley Dynamic should be used as the smoothing mechanisms where the moving average is choppy or ranging.
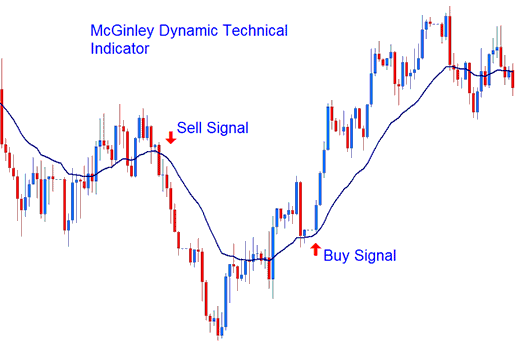
- Bullish, Buy Signal - A buy signal is generated when price is crosses above the indicator.
- Bearish, Sell Signal - A sell signal is generated when price is crosses below the indicator.
Technical Analysis in Forex Trading
