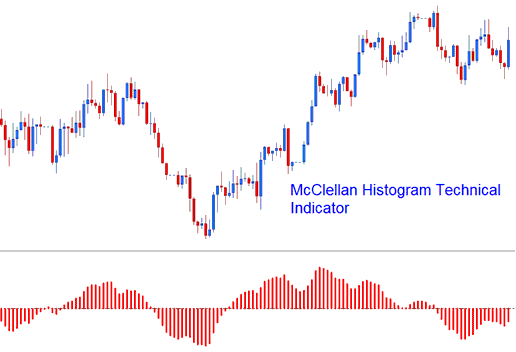
McClellan Histogram Analysis and McClellan Histogram Signals
The McClellan Histogram shows the difference between the McClellan Oscillator and its signal line as a bar graph, which is known as a histogram.
This is a technical tool that goes up and down, and the line in the middle helps show when to buy or sell.

McClellan Histogram
Technical Analysis and Generating Signals
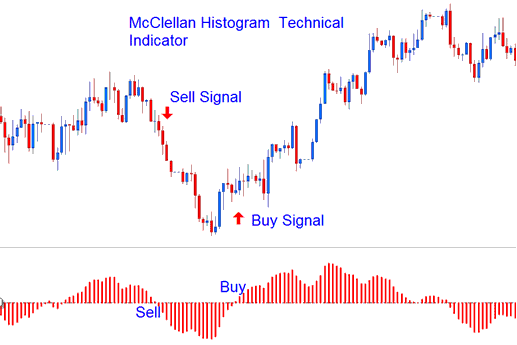
Histogram tells about the power of a trade. Signals come from using the centerline crossing method.
- Bullish trading signal - Above Zero
- Bearish Signal - Below Zero
There are two main ways to use this indicator to help you find possible chances to trade.
Zero-Level Crossover Signal: When the indicator's histogram advances above the zero line, this issues a buy signal: conversely, if the histogram crosses beneath the zero mark, it generates a sell signal for trading.

Technical Analysis of FX Trading:
Divergence Trading - A gap between this tool and price chart makes a solid Forex plan. It spots flips in trends or signals to ride the current move.
There are several types of Divergence Signals:
Trend Reversal Signals - Classic Divergence Trading Setup Signals
- Classic Bullish Divergence Setup Signals - Lower lows on price chart and higher lows on the McClellan Histogram
- Classic Bearish Divergence Setup Signals - Higher highs on price chart & lower highs on McClellan Histogram
Trend Continuation Trading Signals - Hidden Divergence Trade Setup Signal
- Hidden Bullish Divergence Trade Setup Signals- Lower lows in McClellan Histogram and higher lows on the price chart
- Hidden Bearish Divergence Trade Setup Signals- Higher highs in the McClellan Histogram and lower highs on the price chart
To Learn more about divergence navigate to the divergence lesson on this site
Explore Additional Topics and Tutorials:
- How Can I Trade with FX Technical Indicators Described?
- How to find and list all forex pairs in MetaTrader 4
- Download Forex Expert Advisors for MetaTrader 5 in MQ5 Expert Advisor Forum
- How is S and P ASX200 Index Traded on the MetaTrader 4 & MetaTrader 5 Trade Platform?
- Gann Swing Oscillator Gold Indicator Technical Analysis in XAUUSD
- Linear Regression Acceleration XAUUSD Indicator Technical Analysis
- How to Interpret/Analyze MT5 Fibonacci Pullback in MT5 Platform
- Piercing Line Forex Candle vs Dark Cloud Cover Pattern Meaning
- Trading SX 50 Indices in MetaTrader 4 and 5 Platforms
- Gold Candles Charts, Line Charts and Bar Charts XAU/USD Chart Types
