What's Linear Regression Slope Indicator Forex Buy Signal & Sell Signal?
Linear Regression Slope Forex Indicator Buy Trading Signal
How to Generate Forex Buy Signal Using Linear Regression Slope Indicator
Steps on how to generate forex buy signals using Linear Regression Slope indicator:
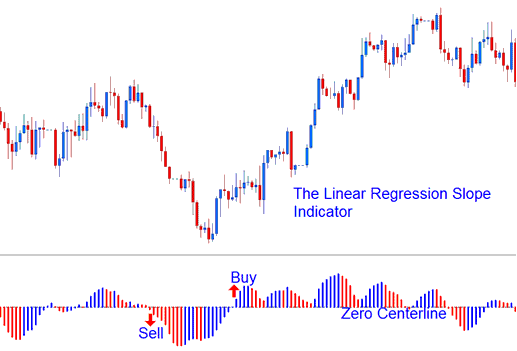
This Linear Regression Slope indicator buy signal tutorial explains how to generate forex buy signals using the Linear Regression Slope indicator as shown below:
The regression slope is displayed as a bi-color histogram that oscillates above and below zero center line. The center-line that's used to generate Forex trading signals is set at the 0 level.
- A rising slope (greater than the previous value of 1 candlestick ago) is displayed in the Blue/Upwards Slope color,
Technical Analysis in Forex Trading
How to Generate Forex Buy Signals Using Linear Regression Slope Technical Indicator
Linear Regression Slope FX Indicator Sell Forex Signal
How to Generate Forex Sell Signal Using Linear Regression Slope Indicator
Steps on how to generate forex sell signals using Linear Regression Slope indicator:
This Linear Regression Slope indicator sell signal tutorial explains how to generate forex sell signals using the Linear Regression Slope indicator as shown below:
The regression slope is displayed as a bi-color histogram that oscillates above and below zero center line. The center-line that's used to generate Forex trading signals is set at the 0 level.
- A declining slope (lower than the previous value of 1 candlestick ago) is displayed in the Red/Downwards Slope color.
Technical Analysis in FX Trading
How to Generate Forex Sell Signals Using Linear Regression Slope Technical Indicator


