OBV and RSI an MA Crossover Trading System
This tutorial will show an example of a system that swing traders can use to come up with a profitable Forex system. Based on the popular stocks strategy, where stock investors use volumes to predict price direction, based on the concept "Volumes always precede price", in forex market, there is no central clearing house where volumes are aggregated, so in we use an indicator that will estimate the volumes. This indicator is known as On Balance Volume.
This indicator is then combined with RSI and Moving Average Crossover System to form a Forex system. The Indicator settings are:
- 5 & 7 LWMA, Linear Weighted Moving Averages
- RSI 14
- OBV
Time-frame: 4 H Chart
Entry Signal
Buy
- Both MA pointing up
- RSI above 50
- OBV is in an uptrend-line or it has broken downward trend-line
Sell
- Both MA pointing down
- RSI below 50
- OBV is in a downtrend-line or it has Broken upward Trend-line
Exit Trading Signal
·OBV trend line is broken
·RSI gives an opposite signal - 50 center mark crossover
You can read more about writing a system rules Writing System Rules and Generating Signals
You can also Read about other Forex Strategies: Strategies List
Example of How to generate Forex Signals with This FX Trading System
Before looking at examples below, using the 138 pips and 177 pips profit example, you need to learn the concept of volumes precedes price and On Balance Volume technical indicator.
The On Balance Volume trading indicator uses volumes to measure the money flowing into a currency or money flowing out of a currency.
OBV indicator most popularly used for stocks analysis. The concept behind On Balance Volume is that Volume precedes price always and when it comes to analyzing the direction of a financial instrument whether a stock or a currency pair nothing is more crucial to this analysis as understanding the volumes that are flowing in and out of a currency. These volumes can be in terms of money, in Forex because charts moves in ticks data, the more money in a currency the more the ticks data, therefore volumes in will measure number of tick data participating in a currency pair.
On Balance Volume acts as a leading indicator giving a one an idea of how much buying pressure or selling pressure is moving into a currency. And because volumes precedes price then this can be used as a good indicator to show the general investor sentiment.
For a Forex system a one requires indicators are calculated differently. For example our system is based on
·RSI - momentum indicator
·MA - direction based indicator
·OBV - volume based technical indicator
A system like this give a good overall picture of the market movement by taking into account 3 different calculation methods as opposed to using 3 oscillators that give signals based on the same calculation technique.
The OBV will measure the tick volume of a currency, for every candlestick. If you use the 1 hour chart time frame, then the volumes will measure the total volume for the 1 hour. If you use day charts then the volume will measure the total volumes for the currency for the whole day.
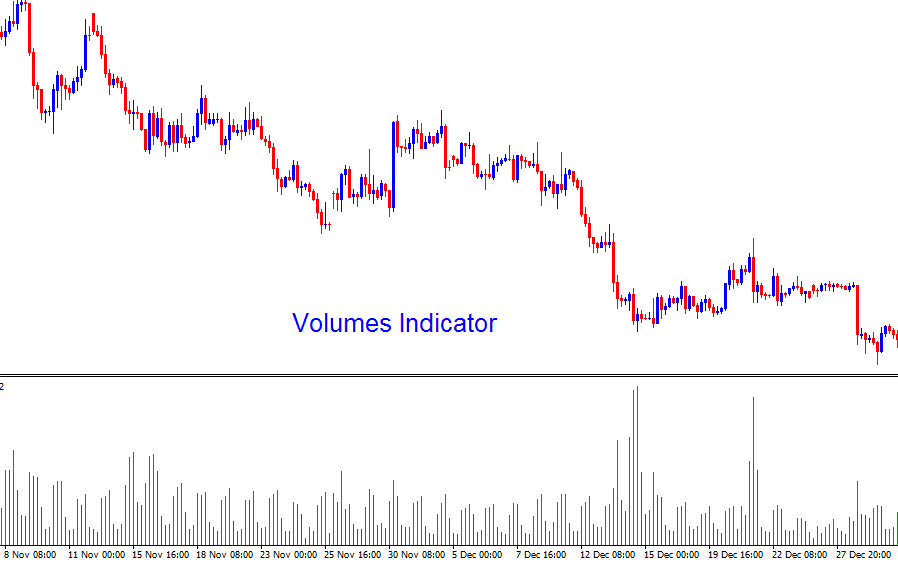
However, the volumes indicator does not show the direction of the volumes, only differentiating by colors for the different candlesticks, Green for Bullish Candlesticks & Red for Bearish Candles.
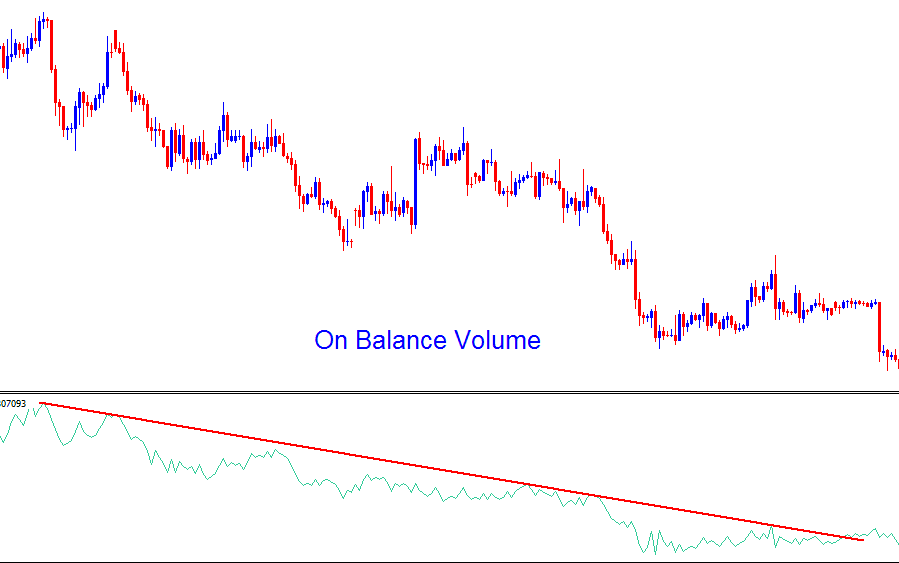
This is where the On Balance Volume comes in & adds a direction to the volumes & shows the overall direction that the volumes are flowing, whether into or out of a currency.
Volume Precedes Price
Volumes always precede price, this makes volumes a leading technical indicator. Knowing how to interpret this helps a trader make better decisions when it comes to predicting where the market direction is going to be moving to next.
When the volume rises it shows that money is starting to flow into a currency. Because volumes will precede the price, the next thing is that the value of a currency will then go up. When the OBV is going up it shows there are more buyers buying a currency than the sellers selling it.
When the volume falls it shows that money is starting to flow out of a currency. Because volumes will precede the price, the next thing is that the value of a currency will then go down. When the OBV is going down it shows more trading volume is going short than long.
Subsequently when a downward trend line of the OBV is broken it shows that sellers are starting to take profit and close their orders.
Likewise when the upwards trend line of the OBV is broken it shows that the buyers are starting to close their long positions and take their profits.
Because the On Balance Volume will add direction to the volume and form a general direction, a trader can compare the two, the price direction and the OBV direction. The direction of these two should correspond but when there is a disconnect between these two then one should pay attention to know when to exit the market or when to open an order.
On Balance Volume is a leading indicator & a trader using this indicator can avoid entering a market when it is too late. This Indicator is also a good indicator to show when to take a profit early enough before the market takes away all your profit.
Forex Indicator Formation
The OBV is the cumulative addition & subtraction of volume based on price direction.
Upwards direction - adds volume/ technical indicator moves up
Downward direction - subtracts volume/ technical indicator moves upwards
Sideways market/Range market - technical indicator moves Sideways
Because price moves in a zigzag manner, the OBV trading indicator will also form in a zigzag manner
Price FX Trading Trend-lines
Most Traders will use these to generate buy and sell signals.
For our System we shall use the OBV indicator to confirm these buy sell signals from price trend-lines.
We shall draw a Trend-line on both the price and Indicator. If both give the same signal we buy or sell depending on direction.
These strategy will be used to determine two things.
Continuation of the current market direction
Reversal of the current market direction
Example of this Strategy
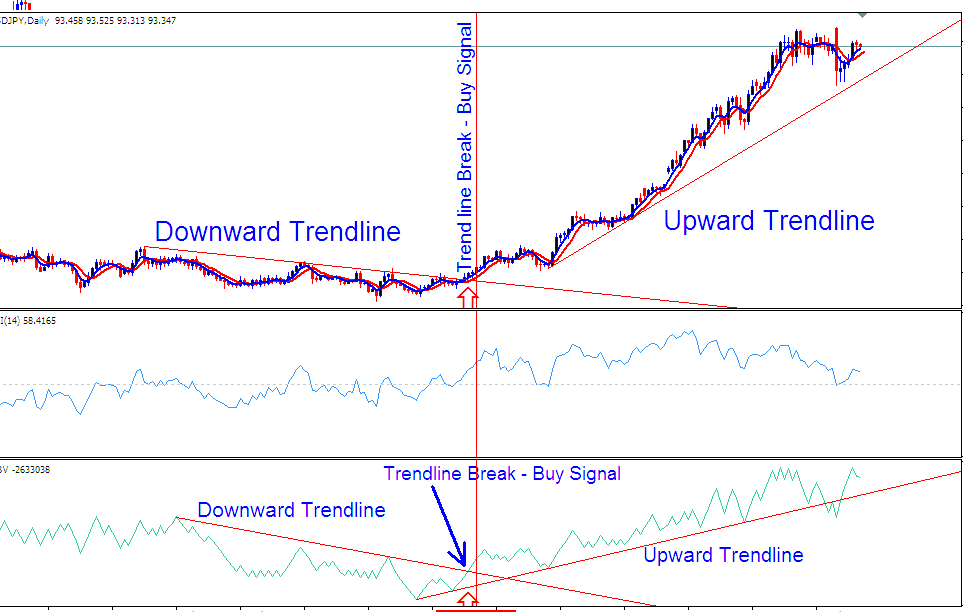
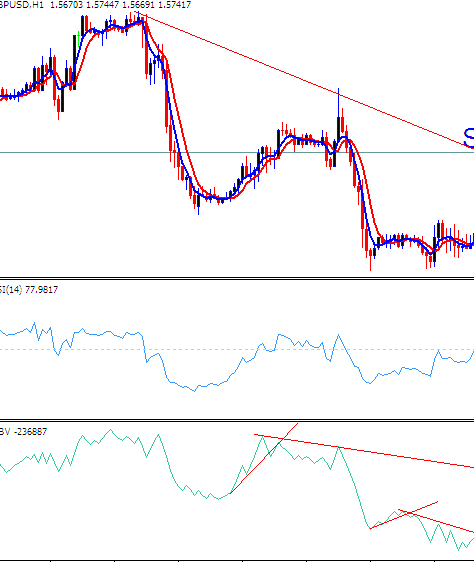
1. Downwards Bearish Market
In the above chart the first half of this currency pair is bearish. This can be shown by the price trend-line that shows a downward direction. This price downward trend-line is also confirmed by the downward trend-line on the indicator - as long as these two move in the same direction then the direction of the currency remains decisively downwards.
Because volumes precede price, one can hold on to his short trades because the market direction will not reverse, before OBV gives a warning.
2. Trend Change
Halfway through this chart there was a market reversal marked by the vertical line. This reversal signal was generated when there was a trend-line break as shown on the chart.
From the chart you can see that the OBV gave the reversal signal just before the price trend-line was broken generating a reversal signal. If you had opened a sell this is where you would have closed all your trades.
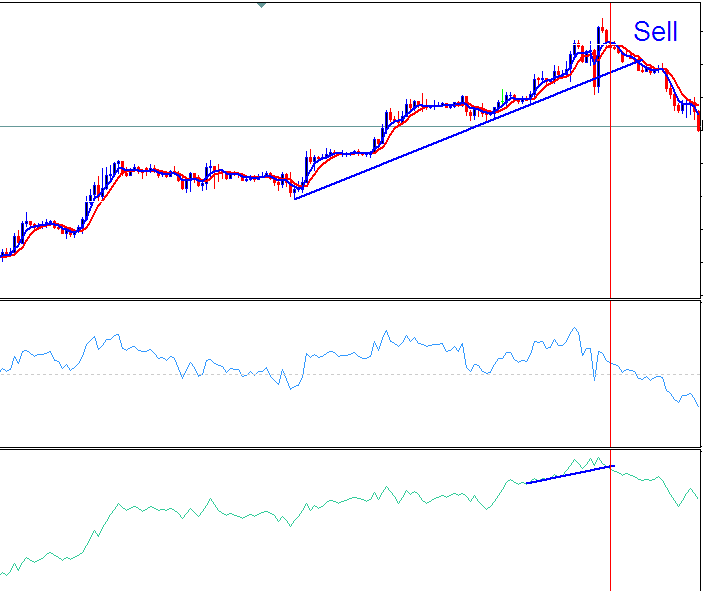
3. Upwards Bullish Market
Trading a market reversal can be sometimes tricky, but the reversal signal generated above was generated at the optimum time and price continued to move up after this reversal signal was generated.
For this you would have just bought the currency when the two trend-lines were broken to the up side giving a buy signal. This buy was also a good signal in that the On Balance Volume had already formed an upward trend-line by the time the downward trend-line was broken.
The new OBV upward trend-line confirmed the direction of the market as a buy and more traders will open buy orders and as long as it holds, as it did in the above example then the price will continue moving upwards.
After this signal was given you can see that later the price formed a decisive upward trend-line that matched the OBV upward trend-line. As long as the two kept moving upwards then the market was firmly upwards.
Whipsaws
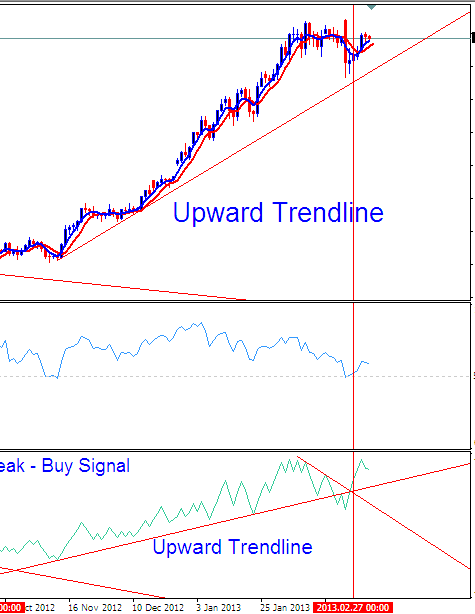
4. At the end of this upwards direction, OBV gave a whipsaw as if to break the upward trendline. However, even if you had opened a short trade because of this new signal that had formed as shown above you would have quickly closed your sell orders before they reversed because the OBV soon broke this downward trend-line as shown above and therefore the sell trade which was forming is now not valid.
One thing which a trader must learn to avoid as with any other Forex strategy is that whipsaws might be generated. The best way to avoid this is to exit as soon as the OBV trend-line is broken especially when you are trading the reversal signals.
For the above example once you exit the short trade, after the new OBV down trend-line was broken it shows there were still more buyers in this currency and it is better to exit any reversal trades that you might have opened, this is because the price might as will move further upwards as shown by the indicator moving upwards.
Because the OBV still went up even after touching and breaching it a little, the OBV upward trend-line still held therefore the upward bullish direction is still intact according to our analysis and any further trades here are still buy. Whether the system is right (I bet you $100 dollars it is) I do not know, this currency pair is USDJPY day chart, The Date is: 05-March-2013, get MT4 and check if the system got this one right on USDJPY chart. But I can bet you the indicator is sharply moved upwards and Volume Precedes Price, So price will also move sharply up, soon.
You can use it on any time frame, but for this system the best time frames to trade this strategy is 1 hour chart, 4 hour Chart and Day Chart. 4 hour chart most accurate with this method some currency pairs are good with strategy other not, major pairs are the best for this volume based strategy because they have a lot of trading volume full time. 1 hour with this strategy is good for day traders who are opening transactions for hours only, the swing method with this strategy requires more capital to hold trades.
Sell Forex Signal
The system generated a perfect sell on GBPCHF as shown below
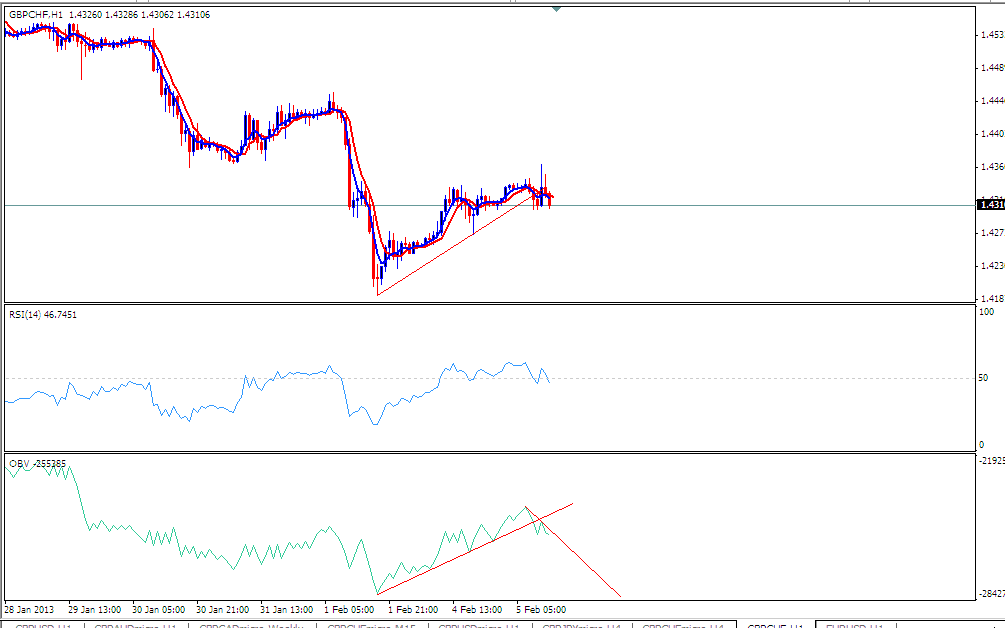
From the above image the GBP USD then went down about 174 pips, The system was able to generate a sell at the best time with a high reward to risk ratio as shown in the picture below.
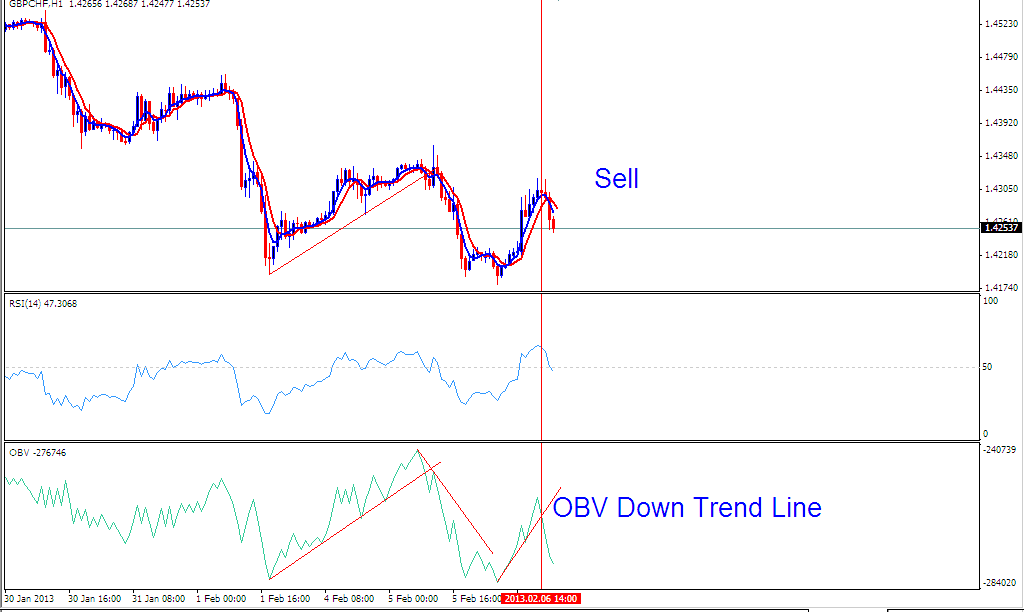
The system also gave an exit signal once this downtrend line on OBV was broken. The price then retraced upwards after which another sell was generated shortly afterwards as shown by the above vertical line.
GBPUSD Sell Signal
From the image below a sell was generated on GBPUSD
One would have held the same currency pair for a few hours as shown below when the exit signal was generated by the indicator as shown below, a good place to take profit of 138 pips
After the exit signal was generated a trader should have been quick to take the profit although this was just a retracement as shown below and as soon after a few hours another sell signal was generated by the system and the On Balance Volume indicator. By drawing an upwards trend line for this retracement you will recognize that a new sell signal has already been generated by this system.
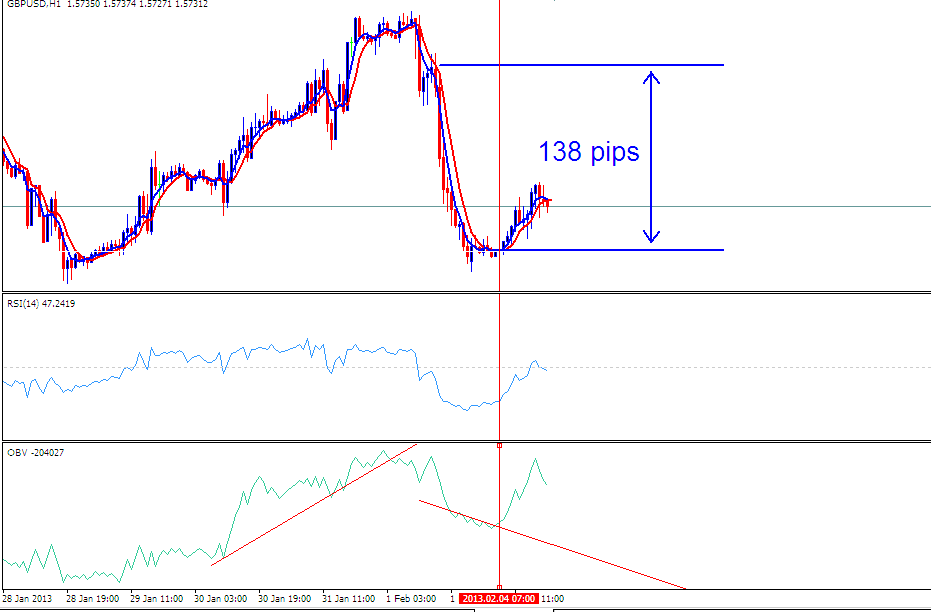
Trend-line drawn on OBV generating a new sell signal.
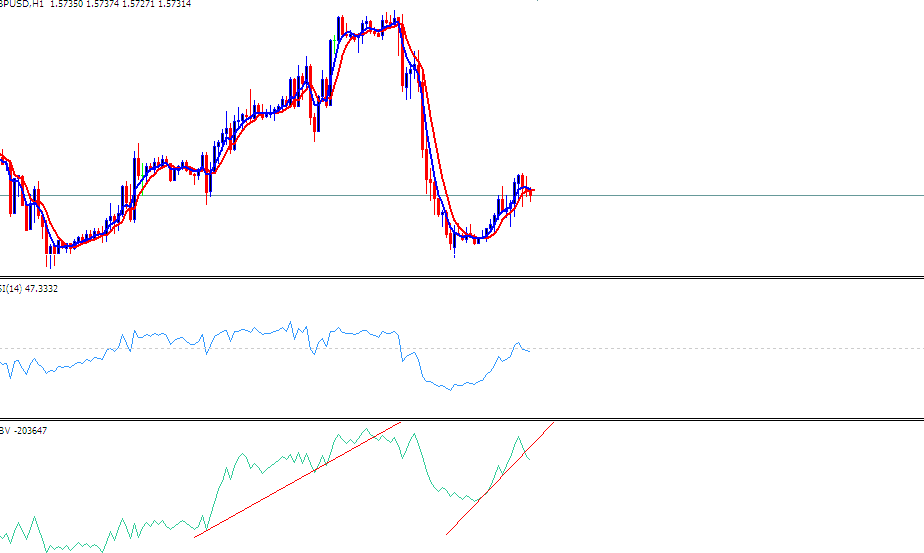
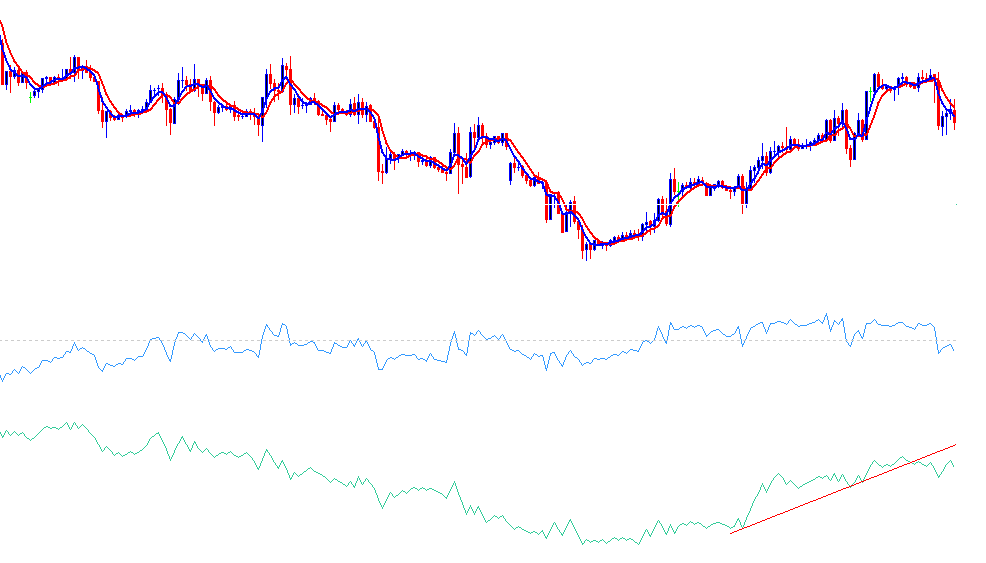
The signal generated above also gave a good profit when the GPBUSD went downwards as shown on the chart below.
EURUSD Sell Signal
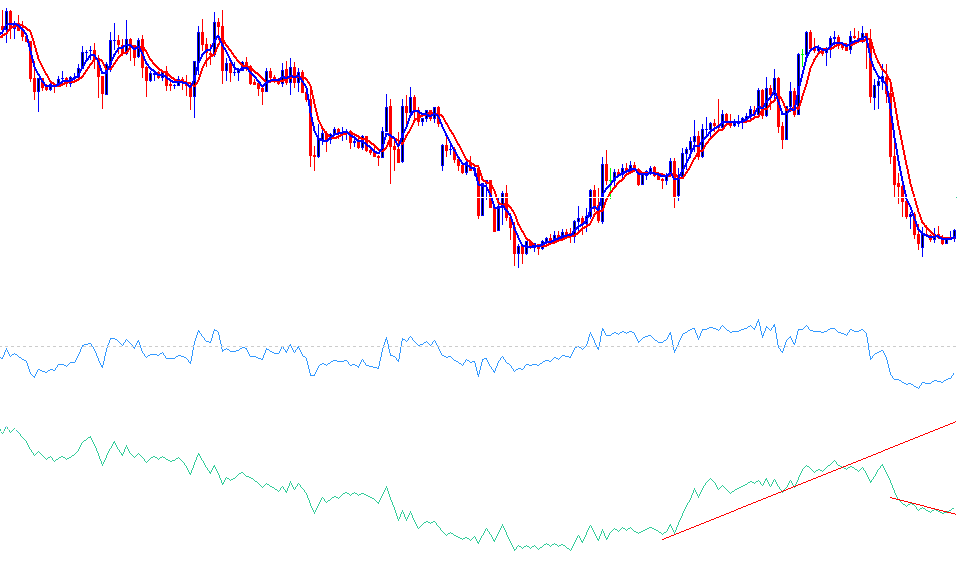
Take Profit after a few hours of 177 Pips, Exit Signal generated when the OBV downtrend line was broken giving a take profit level, although the next signal generated seemed like a buy, the trend is still downwards.
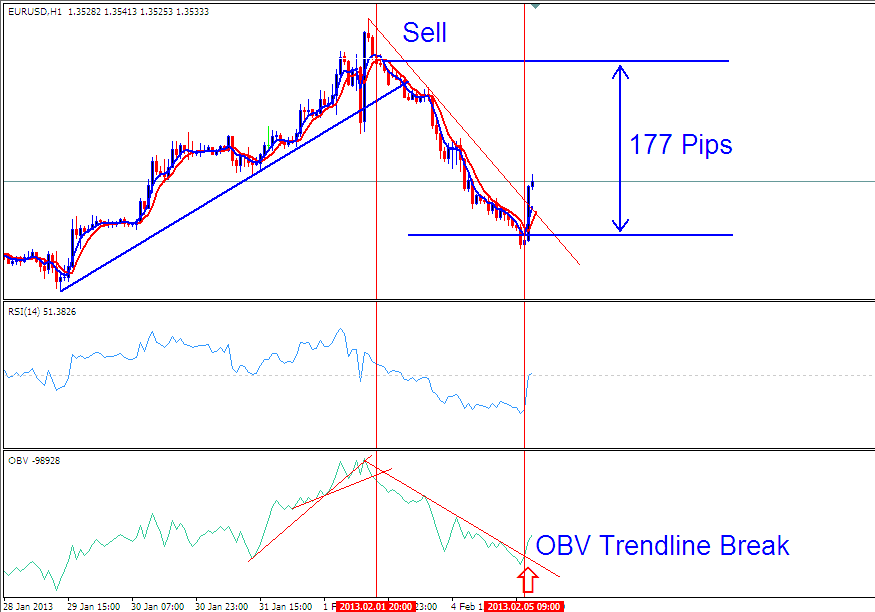
Take Profit after a few hours of 177 Pips, Exit Signal generated when the OBV downtrend line was broken, this was time to take profit.


