How to Add McClellan Histogram on MT4 Charts - Adding MT4 McClellan Histogram Indicator
Step 1: Open Navigator Window Panel on Forex Trading Platform
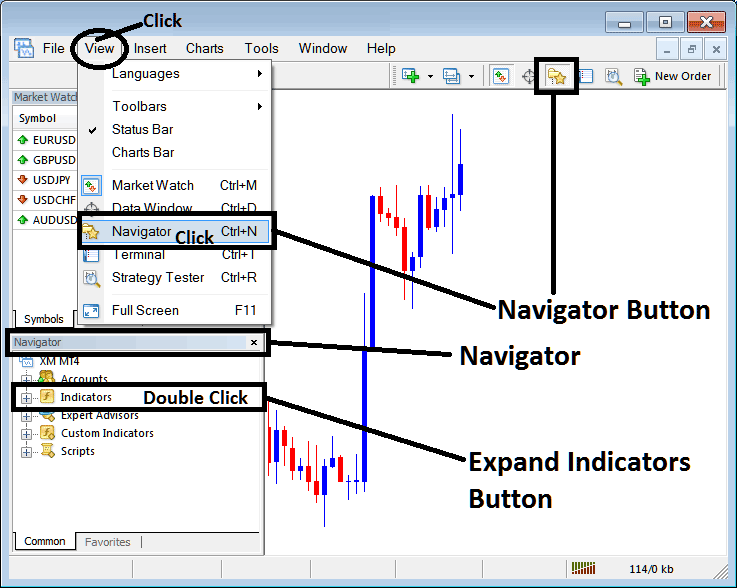
Open Navigator window as shown & illustrated below: Go to "View" menu (click on it), then select "Navigator" window (click), or From Standard Tool Bar click the "Navigator" button or press keyboard short cut keys "Ctrl+N"
On Navigator window, select 'Technical Indicators', (DoubleClick)
How to Add McClellan Histogram Indicator on MetaTrader 4 - MT4 McClellan Histogram Technical Indicator
Step 2: Expand the Indicators Menu on the Navigator - Adding McClellan Histogram MT4 Indicator
Expand the menu by clicking the expand button marker (+) or double click the "indicators" menu, after this the button will appear as (-) and will now display a list as shown below - select the McClellan Histogram forex chart indicator from this list of forex indicators so as to add the McClellan Histogram indicator on the forex chart.
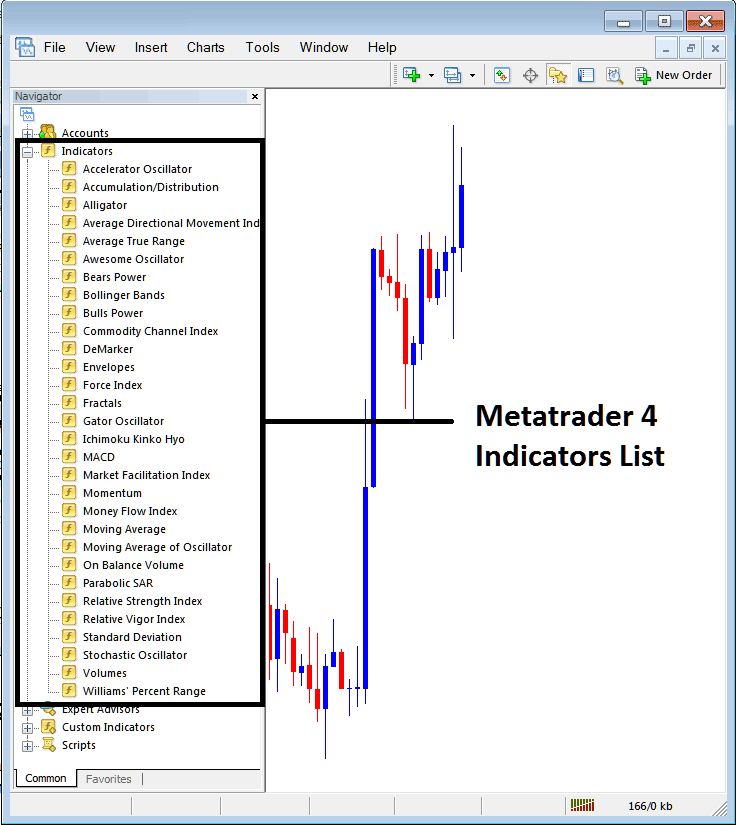
How to Add McClellan Histogram Indicator - From the Above window you can then place McClellan Histogram indicator that you want on the Forex chart
How to Add Custom McClellan Histogram Indicator to MT4
If the technical indicator you want to add is a custom indicator - for example if the McClellan Histogram technical indicator you want to add is a custom indicator you will need to first add this custom McClellan Histogram indicator on the MetaTrader 4 platform & then compile custom McClellan Histogram indicator so that the newly added McClellan Histogram custom indicator pops up on the list of custom indicators in MetaTrader 4 software.
To learn how to install McClellan Histogram indicators on MT4, how to add McClellan Histogram indicator window to MT4 and how to add McClellan Histogram custom indicator in MT4 - How to add a custom McClellan Histogram indicator in MetaTrader 4.
About McClellan Histogram Technical Indicator Described
McClellan Histogram Technical Analysis & McClellan Histogram Signals
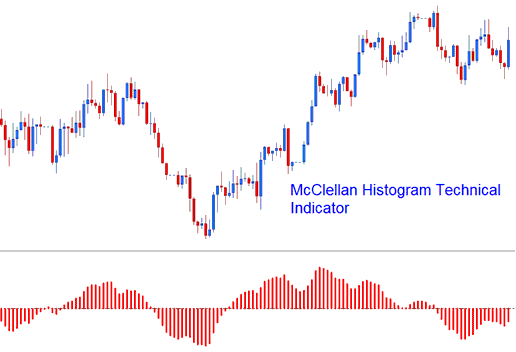
The McClellan Histogram is a graphical representation of the McClellan Oscillator and its signal line. This difference between the two is plotted as a histogram.
This is an oscillator indicator, the center line is the zero cross-over mark which is used to generate buy & sell signals.
McClellan Histogram
Forex Technical Analysis & Generating FX Signals
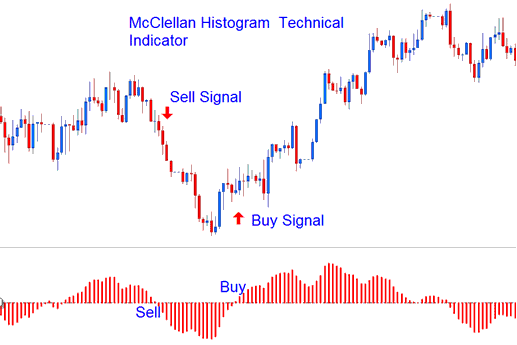
The Histogram is momentum indicator. Signals are generated using the center-line cross over method.
- Bullish signal- Above Zero
- Bearish Signal - Below Zero
There are two fundamental techniques for using this indicator to generate trading signals.
Zero-Level Crossover- When the histogram crosses above the zero a buy trading signal is generated. Otherwise, when the histogram oscillator crosses below zero a sell trading signal is generated.
Technical Analysis in Forex Trading
Divergence Trading - divergence trading between this indicator & the price chart can prove to be very effective Forex trading strategy in identifying potential trend reversal signals and trend continuation signals.
There are several types of FX Divergence Forex Trading Signals:
Trend Reversal Signals - Classic Divergence Signals
- Classic Bullish Divergence Signals - Lower lows on price chart and higher lows in the McClellan Histogram
- Classic Bearish Divergence Signals - Higher highs on price chart and lower highs in the McClellan Histogram
Trend Continuation Signals - Hidden Divergence Signal
- Hidden Bullish Divergence Signals- Lower lows in McClellan Histogram and higher lows in price chart
- Hidden Bearish Divergence Signals- Higher highs in McClellan Histogram and lower highs in price chart
To Learn more about divergence navigate to the divergence trading topic on this website


