How to Add Linear Regression Indicator on MetaTrader 4 Charts
Step 1: Open Navigator Window Panel on Forex Trading Platform
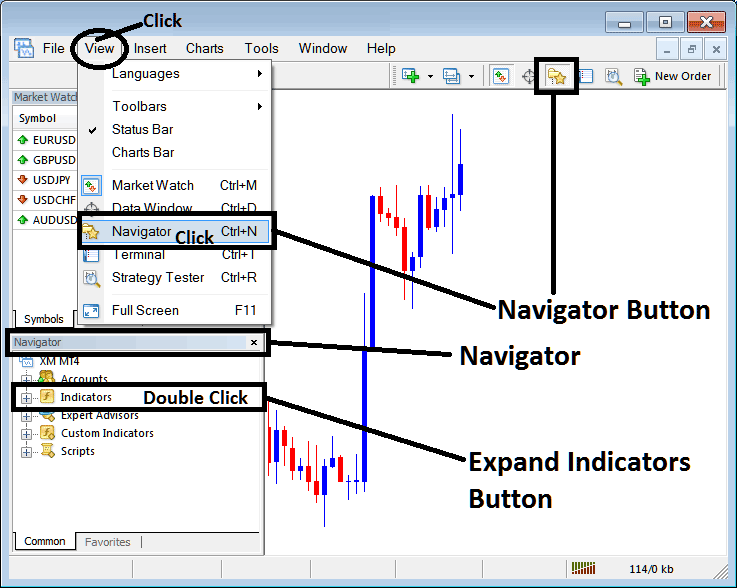
Open Navigator window as shown & illustrated below: Go to "View" menu (click on it), then select "Navigator" window (click), or From Standard Tool Bar click the "Navigator" button or press keyboard short cut keys "Ctrl+N"
On Navigator window, select 'Technical Indicators', (DoubleClick)
How to Add Linear Regression Indicator on MetaTrader 4 - MT4 Linear Regression Technical Indicator
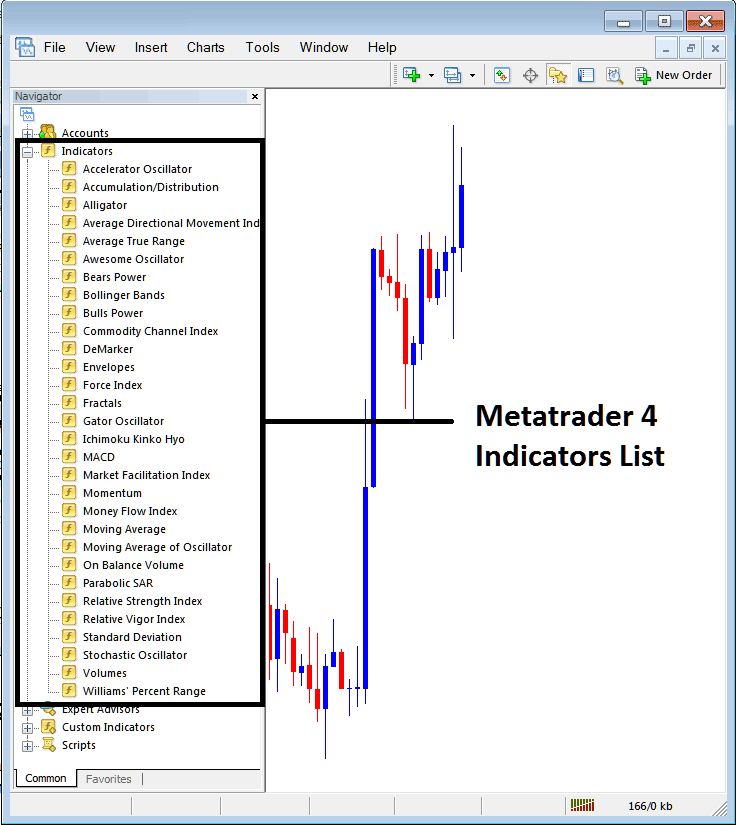
Step 2: Expand the Indicators Menu on the Navigator - Adding Linear Regression MT4 Indicator
Expand the menu by clicking the expand button marker (+) or double click the "indicators" menu, after this the button will appear as (-) and will now display a list as shown below - select the Linear Regression forex chart indicator from this list of forex indicators so as to add the Linear Regression indicator on the forex chart.
How to Add Linear Regression Indicator - From the Above window you can then place Linear Regression indicator that you want on the Forex chart
How to Add Custom Linear Regression Indicator to MT4
If the technical indicator you want to add is a custom indicator - for example if the Linear Regression technical indicator you want to add is a custom indicator you will need to first add this custom Linear Regression indicator on the MetaTrader 4 platform & then compile custom Linear Regression indicator so that the newly added Linear Regression custom indicator pops up on the list of custom indicators in MetaTrader 4 software.
To learn how to install Linear Regression indicators on MT4, how to add Linear Regression indicator window to MT4 and how to add Linear Regression custom indicator in MT4 - How to add a custom Linear Regression indicator on MetaTrader 4.
About Linear Regression Technical Indicator Described
Linear Regression Technical Analysis & Linear Regression Signals
Another name for a regression line is a line of the best fit/best fit line. This indicator plots the trend of the currency price over a specified duration of time. The market trend is determined by calculating a Linear Regression Trend Line using the "least squares fit" method. This method helps to minimize the distance between the price data points and the line of best fit.
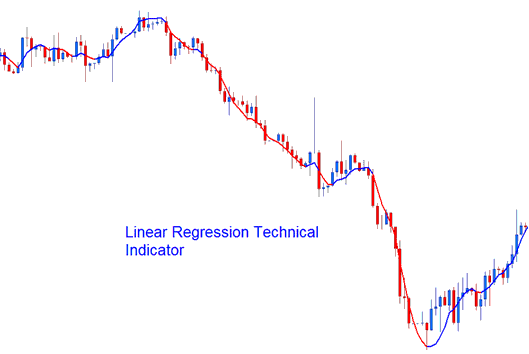
Unlike the straight Regression Trend-Line technical indicator, the technical indicator draws the end values of multiple Linear Regression trend-lines. Any single point along the Linear Regression will be equivalent to the end value of a Regression Trend-line, but the resulting trend-line looks like the Moving Average.
But unlike the Moving Average, this indicator doesn't show as much delay since it is fitting a line onto data points rather than averaging them.
The Linear Regression is a prediction of the tomorrow's price plotted today, one day before. When the prices are steadily higher or lower than the forecast price, then a trader can expect them to quickly return to more realistic fore-casted levels.
In other terms, this indicator shows where the chart prices "should" be trading based on a statistical basis & any disproportionate deviation from the regression line is likely to be short-lived.
Forex Technical Analysis & How to Generate Signals
This indicator allows for price selection, adjusting number of periods and smoothing of price data before applying the calculation and the selection of smoothing type.
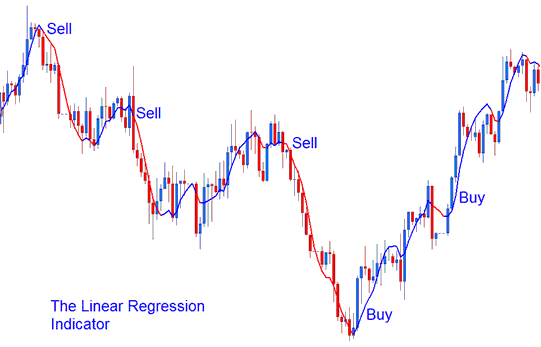
This technical indicator looks like a moving average but it has a bi-color representation.
- Bullish Signal (Blue color) - A rising line (greater than its previous value 1 previous bar before) is displayed in the up trend blue color, while
- Bearish Signal (Red color) - a declining line (lower than its previous value 1 previous bar before) is displayed in the down trend red color.
Technical Analysis in Forex Trading


