How Do I Analyze Double Bottoms Chart Pattern?
How Do You Trade Double Bottoms Chart Pattern?
To learn how to interpret and trade using double bottoms chart pattern a trader will first of all need to learn double bottoms pattern technical analysis described below.
How Do I Analyze Double Bottoms Chart Pattern?
Double bottom forex pattern is a reversal chart pattern which forms after an extended downwards forex trend.
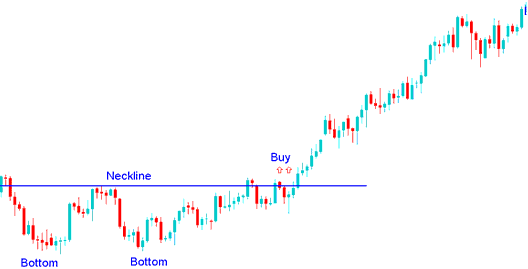
Double bottom forex chart pattern is made up of two consecutive forex price troughs which are roughly equal - with a moderate peak in between the 2 forex price troughs.
Double bottom forex chart pattern is considered complete once forex price makes the second low and then penetrates the highest forex price point between the forex price lows - this highest forex price point between the forex troughs is called the neckline.
Buy forex trading signal from double bottoms chart pattern is generated when the price breaks above the neckline to the upside.
In forex trading the double bottoms pattern is an early warning forex trading signal that the downward forex trend might reverse.
Double bottom forex chart pattern is only considered confirmed once the neckline is broken - in double bottoms chart pattern the neckline is the resistance level for the forex price. Once this resistance level is broken by the forex price the forex price will then move up.
Summary: How Do You Interpret Double Bottoms Chart Pattern?
- Double bottoms forex chart pattern is formed after an extended forex downward trend move
- Double bottoms forex chart pattern signals that there will be a reversal in the forex trend
- Forex traders will buy when the price breaks-out above neck line: as described on the double bottoms chart pattern example below.
How Do You Interpret Double Bottoms Chart Pattern?
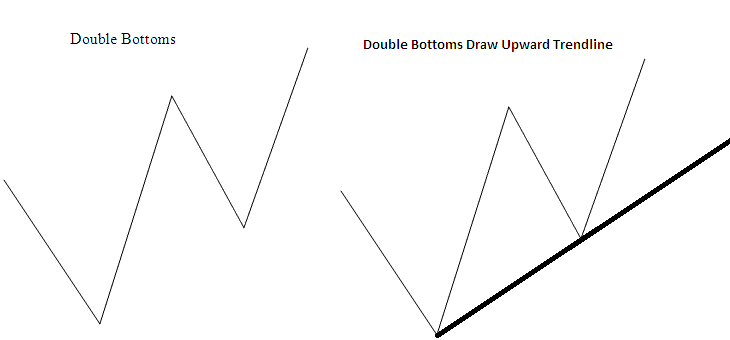
The double bottom chart pattern look like a W Shape pattern, the best double bottoms chart pattern reversal forex trading signal is where the second forex price bottom is higher than the first forex price bottom as shown on the forex trading example below.
This means that the reversal forex trading signal from the double bottom pattern can be confirmed by drawing an upwards forex trend line as shown on the double bottoms chart pattern example below. If a trader opens a buy forex trade the forex stop loss order will be placed just below this upwards trend line.
How Do I Interpret Double Bottoms Chart Pattern?
How Do You Interpret Double Bottoms Chart Pattern?


