How Do You Draw a Forex Trend-line on a Chart?
How Do You Draw a Forex Trend-line on a Forex Chart?
Course on How Do I Draw a Forex Trend-line on a Chart - How Do You Draw Forex Trendlines on Charts
Principles of How Do You Draw a Forex Trend-line on a Chart?
Use candlestick charts to draw trend lines
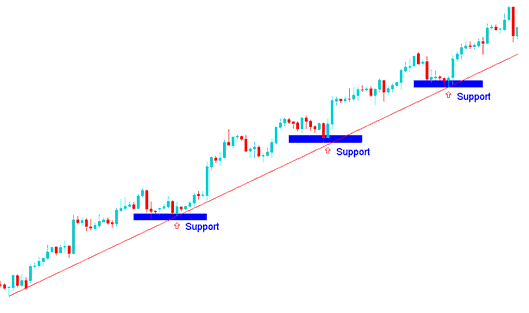
- The areas used to draw a trendline on a chart are along the lows of the price bars in a bullish market. An upwards bullish trend is defined by higher highs & higher lows.
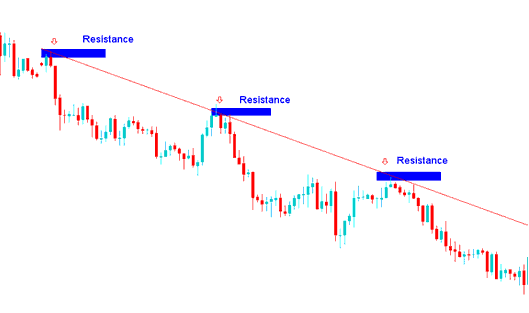
- The points used to draw a trend-line on a trading chart are along the highs of price bars in a bearish market. A downward bearish trend is defined by lower highs and lower lows.
- The points used to draw trend-lines on the charts are the extremes areas - the high or the low price. These price extremes are critical because a close beyond the extreme chart points tells traders the trend of forex instrument might be changing. This is an entry or an exit signal.
- The more often a trendline on a chart is hit but it is not broken, the more powerful its market signal.
Example 1: How Do You Draw a Upward Trend line in a Chart?
To draw an upwards trendline on a trading chart use two support areas in a bullish upward trend so that to draw the upwards trend line and then extend the trend-line as shown & shown below. The upwards trendline on a chart will show the general direction of prices and as long as the price is above this upward trendline then the upwards trend will remain intact - bullish upwards trend.
If prices move below the upwards trend-line which is the support zone for the bullish upwards trend then traders should closeout all their open trade positions - because this might be a market trend reversal. In an upward trend price should generally stay above support level which is marked & tagged by the upwards trendline on the trading charts.
Draw a Upward Trend line in a Chart in FX Trading

How Do You Draw an Upward Trend line in a Chart
Example 2: How Do You Draw a Downward Trend line in a Chart?
To draw a downwards trend-line on a chart use 2 resistance points in a bearish downwards trend so as to plot the downwards trend line and then extend the trend-line as shown below. Downwards trend-line on a chart will show the overall direction of trading prices & as long as price is below this downward trend-line then the downwards trend will remain intact - bearish downwards trend.
If prices move above the downwards trend line which is the resistance zone for the bearish downwards trend then traders should closeout all their open trade positions - because this may be a market trend reversal. In an downward trend price should generally stay below the resistance area which is marked & tagged by the downwards trend line on a chart.
Draw a Downward Trend line in a Chart in FX Trading

How Do You Draw a Downwards Trend line on a Chart
How Do You Draw a Forex Trend-line in a Chart?
Get More Courses and Topics:
- Placing Arrows in XAUUSD Charts on MT4 Platform Software
- Bullish Trade Divergence RSI Index Trading and Bearish Divergence RSI Index Trading
- FX AEX 25 FX Stock Index AEX 25 Symbol
- Piercing Line Candle vs Dark Cloud Cover Pattern Meaning
- How Can I Use MT4 Acceleration/Deceleration Indicator on MetaTrader 4 Software Platform?


