Ehlers Fisher Transform Forex Trading Technical Analysis Signals
Developed by John Ehlers,
Originally used to trade Stocks and Commodities Market.
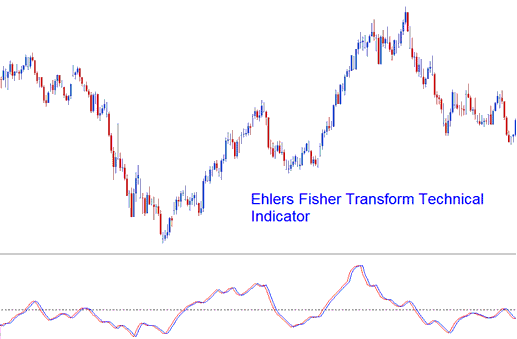
Ehlers Fisher Transform has two lines, the Fisher Transform line & the signal line: signals are generated when there is a crossover of these 2 lines which looks like the stochastic oscillator.
It was designed to define major price reversals using the rapid response time and sharp, distinct turning points making it a leading indicator.
This indicator is based on the assumption that prices do not have a Gaussian probability density function (bell shaped curved movement), but that by normalizing price and applying the Fisher Transform you can create a nearly Gaussian probability density function on the lines drawn.
Ehlers Fisher Transform
Forex Technical Analysis & How to Generate Signals
Trading signals can be generated with pin-point accuracy by using the cross-over points of the Fisher Transform and its signal line.
However, this Ehlers Fisher Transform is not very accurate, as with all leading technical indicators, it gives many false signals & it's prone to whipsaws, it is therefore recommended to trade it in combination with other technical indicators.
