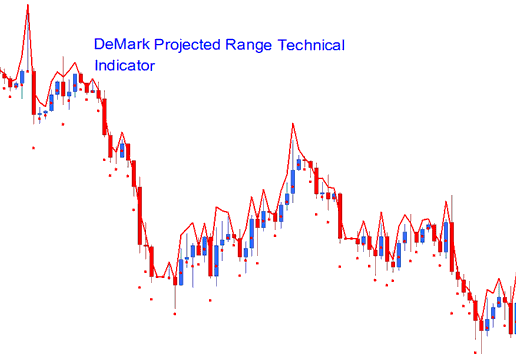
DeMark Projected Range: Buy and Sell Signals
DeMark Projected Range Indicator Buy Signal
How to Generate Forex Buy Signals Using DeMark Projected Range Indicators
Methodological steps for generating forex purchase signals utilizing the DeMark Projected Range indicator:
This DeMark Projected Range indicator buy signal tutorial describes and explains how to generate forex buy signals using the DeMark Projected Range indicator just as is shown:
A Guide on How to Produce Forex Buy Trading Signals Using the DeMarks Projected Range Technical Indicator
DeMark Projected Range Trading Indicator Sell Trade Signal
Generating Forex Sell Signals Using DeMark Projected Range Indicator Explained
Essential steps for deriving forex sell trade signals utilizing the DeMark Projected Range indicator:
This DeMark Projected Range indicator sell trading signal guide describes and explains how to generate forex sell trade signals using the DeMark Projected Range indicator like shown:
How to Generate Forex Sell Trade Signals Using DeMark Projected Range Indicator
This DeMark Projected Range indicator shows the possible highest and lowest prices a chart price might reach.
This is known as the range projection, and it is figured out by using the prices at the beginning and end of the most recent time period.

DeMarks Projected Range
Technical Analysis and How to Generate Trading Signals
This indicator will point out two levels: what it predicts as the highest and lowest prices for a certain time period, which will be your guide.
Bullish Uptrend Signal
If the subsequent price bar opens above the anticipated high, the market is likely to continue its upward trend.
Bearish downtrend Signal
If the subsequent price candlestick opens below the predicted low price point, the market is expected to continue its downward trajectory.
Ranging Market
If the subsequent price candle opens within the anticipated price range, it signals that the market is likely to maintain its current sideways movement.
Study Additional Tutorials and Subjects:
- SWI20: Real-World Index Trading Strategy
- Bollinger Percent B XAU/USD Indicator Technical Analysis
- A Comprehensive Trading Guide and Tutorial Course for Trading the NETH25 Index
- Interpreting/Analyzing Automated XAU/USD Expert Advisor Robots on the MT4 Platform
- Bollinger Bands: Fib Ratios XAUUSD Indicator Analysis
- FX SMI 20 Forex Stock Index SMI 20 Symbol in Forex
- Fundamental Forex Concepts Essential for New FX Traders to Master
- How the MT4 Platform Computes Lot Sizing Specifically for Cent Accounts
