Bollinger Percent B XAUUSD Technical Analysis & Bollinger Percent B XAUUSD Signals
Developed by John Bollinger
Percentage B indicator is derived from Bollinger Bands.
This is an oscillator which has 3 lines - 0, 50, 100
- 0 represents lower Band
- 50 represents middle Band
- 100 represents upper Band
Percentage B oscillates between these 3 points and it shows where the price is in relation to the Three Bollinger Bands.
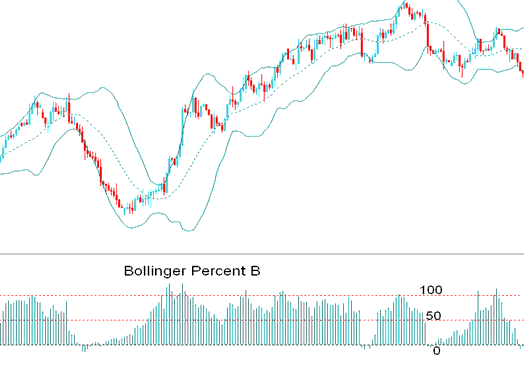
%b indicator
When the gold trading price touches the upper band then the oscillator hits 100, if gold trading price moves above the upper band the oscillator moves to +100
When the gold trading price touches the lower band then the oscillator hits 0, if gold trading price moves below the lower band the oscillator moves to -0
When the gold price touches the middle band then the oscillator will be at 50.
Calculation
Percent B = XAUUSD Price Close - Lower Band * 100
Upper Band - Lower Band
XAUUSD Technical Analysis & Generating Gold Signals
Percent B indicates to what degree the gold price closes above or below any of the bands.
Buy XAUUSD Signal
Oscillator values above 50 is a bullish signal.
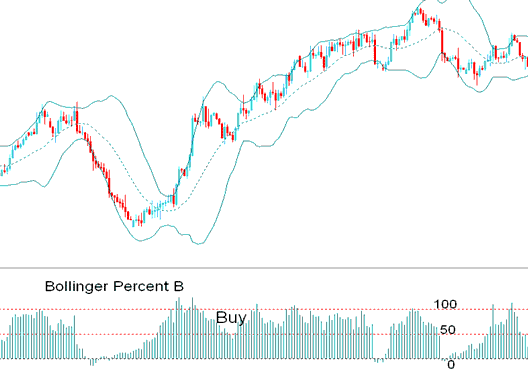
% b Bullish Buy XAUUSD Signal
Sell Gold Signal
Oscillator values below 50 is a bearish signal.
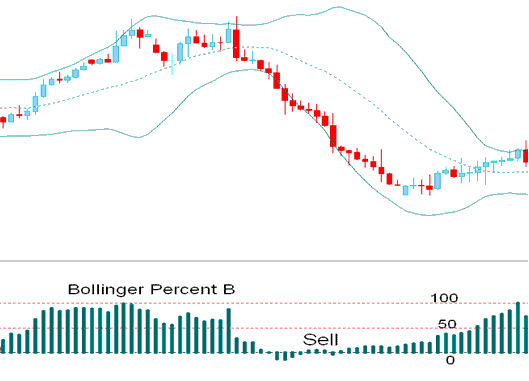
%b Bearish Sell XAUUSD Signal


