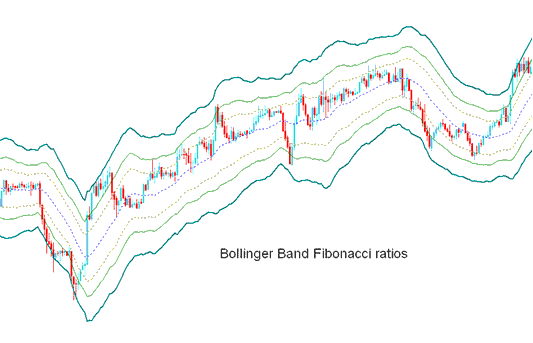
Fib Ratios Technical Analysis & Signals
Derived from the original Bollingers.
The Bollinger Fibonacci tool measures volatility. It skips standard deviations for band width. Instead, it smooths ATR values and multiplies by Fibonacci ratios like 1.618, 2.618, and 4.236.
The smoothed trajectories, after being scaled by the Fibonacci ratios, are subsequently either added to or subtracted from the Moving Average (MA).
This forms 3 upper Fibo bands and 3 lower Fibo bands
The mid band forms basis of the market trend.

XAU/USD Technical Analysis and How to Generate Trading Signals
This indicator used to figure out point of support & resistance for a xauusd.
Lines below represent support levels while those above are resistance levels.
The outermost bands provide the strongest resistance/support.
Inner most bands provide least support/resistance.
The innermost band represents Fibo 38.20% retracement level
The second band represents Fibonacci 50% retracement level
The outermost band represents Fib 61.80 % retracement level
This technical tool is employed to pinpoint potential points where price movement is likely to reverse. (Specifically for XAUUSD Price Pullback Levels)
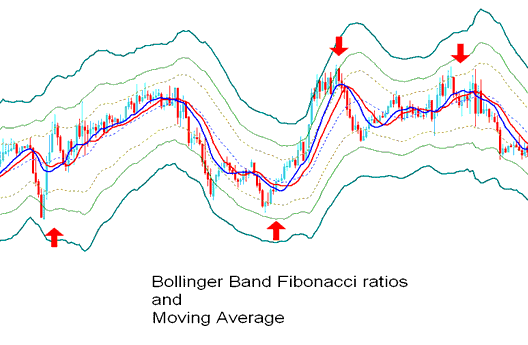
An entry or exit trading signal is triggered when the price interacts with any of the plotted lines and experiences a reversal.
However, it is always good to combine the signal with other confirmation technical indicators like the MA to confirm the signal such as shown below.

Technical Analysis in XAUUSD Trading
Study More Tutorials and Lessons:
- How Do I Set Alligator XAU USD Technical Indicator in Trading Chart in MetaTrader 4 Software Platform?
- How Do You Add a Custom MT5 Indicator on MetaTrader 5 Platform?
- How Do I Use Support and Resistance Indicator in FX?
- The Significant Impact of Forex Leverage on Magnifying Both Profits and Losses
- How to Add the McClellan Histogram to MetaTrader 4 Charts
- Learn FX Lessons and Guides Course for Beginner Traders
