How to Add Support and Resistance Indicator on MetaTrader 4 Charts
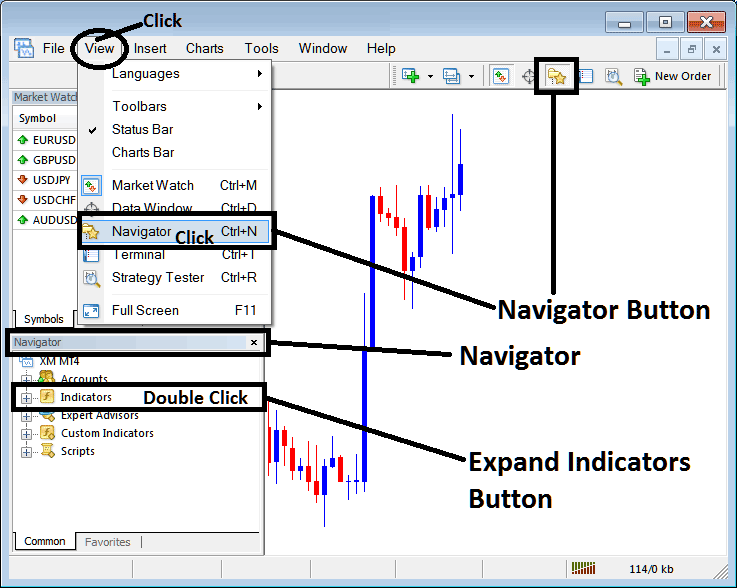
Step 1: Open Navigator Window on Forex Trading Platform
Open Navigator window as shown & illustrated below: Go to 'View' menu (click on it), then select 'Navigator' window (click), or From Standard Tool Bar click the 'Navigator' button or press keyboard short cut keys 'Ctrl+N'
On Navigator window, choose 'Indicators', (Double-Click)
How to Add Support and Resistance Indicator on MetaTrader 4 - MT4 Support and Resistance Indicator
Step 2: Expand the Indicators Menu on the Navigator - Adding Support and Resistance MT4 Indicator
Expand the menu by clicking the expand button marker (+) or double click the 'indicators' menu, after this the button will appear as (-) and will now display a list as shown below - select the Support and Resistance forex chart indicator from this list of forex indicators so as to add the Support and Resistance indicator on the forex chart.
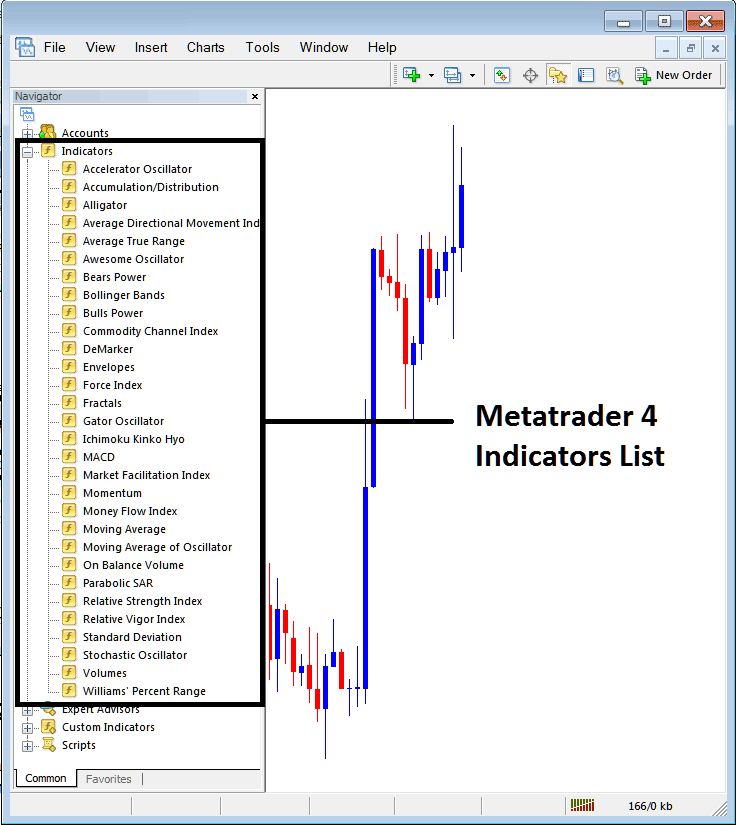
How to Add Support and Resistance Indicator - From the Above window you can then place Support and Resistance indicator that you want on the Forex chart
How to Add Custom Support and Resistance FX Indicator to MT4 Platform
If the technical indicator you want to add is a custom indicator - for example if the Support and Resistance technical indicator you want to add is a custom indicator you will need to first add this custom Support and Resistance indicator on the MT4 platform & then compile custom Support and Resistance indicator so that the newly added Support and Resistance custom indicator pops up on the list of custom indicators in MetaTrader 4 software.
To learn how to install Support and Resistance indicators on MT4, how to add Support and Resistance indicator window to MT4 and how to add Support and Resistance custom indicator in MT4 - How to add a custom Support and Resistance indicator in MetaTrader 4.
About Support and Resistance Technical Indicator Explained
Support and Resistance Technical Analysis & Support & Resistance Signals
Support & Resistance is one of the widely used concepts in Forex trading. Most traders plot horizontal lines to show these levels.
There is also an indicator used to plot these levels automatically and indicate the resistance and support levels.
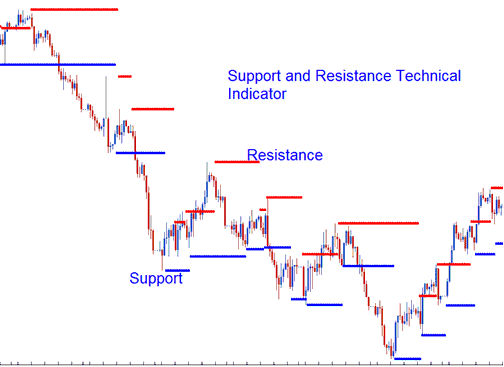
When it comes to these levels price can either bounce off these levels or break these levels.
If a resistance level is broken price will move higher and the resistance level will turn to a support.
If a support level is broken price will move lower and this level will turn to a resistance.
Price where the majority of investors believe that prices will move higher, while resistance levels indicate the price at which a majority of investors feel prices will move lower.
Once price has broken through a support or a resistance then it is likely that the price will continue moving in that particular direction until it gets to the next support or resistance level.
The more often a support or resistance level is tested or is touched by the price and bounces, the more major that particular level becomes.
Forex Technical Analysis & How to Generate Signals
These levels are calculated a trend lines method.
Upward Forex Trading Trend
In an upward trend the resistance & support will generally head upwards
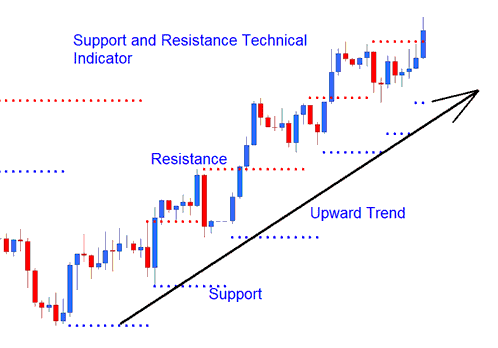
Upwards FX Trading Trend
Downwards Forex Trading Trend
In a downwards trend the resistance & support will generally head downward
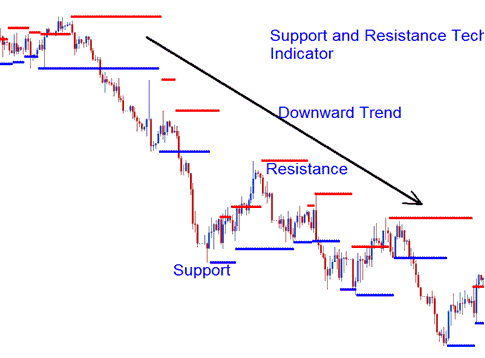
Downwards FX Trading Trend


