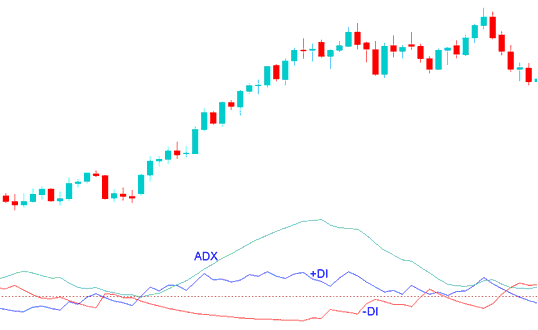
ADX MetaTrader 4 Indicator & ADX Signals
The ADX is a momentum indicator created by J. Welles Wilder.
This indicator is used to measure the strength of market trends on a scale of 0 - 100; the higher the value the stronger the current trend. It should be noted that while the direction of price is crucial to the ADX calculation, the ADX itself is not a directional trading indicator. Trading Indicator values above 30 indicate a very strong trending market, while values below 20 indicate non-trending or ranging market.
Traders typically use the average directional movement index trading indicator as a filter along with the other technical indicators to create a more concrete methodology.
Many traders view levels turning up from below 20 as an early signal of a new emerging trend while declining levels turning down from above 30 as deterioration of the current market trend.
Wilder suggests using the ADX as part of a trading system that includes the +DI & -DI lines. Most platforms integrate the original average directional movement index with the +DI and -DI indicators (DMI Index) and collectively refer to the whole system as the ADX.
In the example below:
ADX is the light green line
+DI is the blueline(bullish line)
- DI is the red-line(bearish line)

- Bullish Trend - when the +DI, blue line is above the -DI, red line
- Bearish Trend - when the -DI, red-line is above the +DI, blueline
Bullish Signal
A bullish trading signal gets generated when +DI line is above the -DI line, when the blue-line is moving above redline.
To identify a strong bullish signal we wait until the trading indicator readings above 20, & the blue-line is above the red line. This is a bullish trading signal because the DMI system identifies the signal as a buy, while levels above 20 shows there is a strong upwards trend.
Bearish Signal
A bearish signal gets generated when red line is above the blue-line i.e. -DI line is above the +DI line. A strong short signal will be generated when this bearish trading signal is accompanied by an ADX value of above 20.
Study More Tutorials & Topics:
- FX Gold Guide
- List of the Different Types of Forex Trading Accounts Explanation
- Demarks Projected Range XAUUSD Indicator Technical Analysis
- How to Analyze Pips in NZDJPY How to Count Pips in NZDJPY
- Stock Index Trade Tutorial Course for Beginners
- How to Analyze Gold Chart for Beginners
- What are ROC, Rate of Change Buy & Sell FX Trade Signals?
- Aroon XAU USD Indicator Technical Analysis on XAU USD Charts
- FX AEX 25 on MetaTrader 4 Index AEX 25 Symbol on MetaTrader 4 Software
- Kase Peak Oscillator & Kase DevStop 2 Indicator Technical Analysis


