Hidden Bullish & Hidden Bearish Divergence Gold
The hidden divergence setup is employed by active online traders as a potential indicator for the continuation of a price trend following a temporary pullback. It signals the resurgence of the initial market direction. This specific configuration is favored because its projected movement is consonant with the sustained trajectory of the market trend.
XAUUSD Hidden Bullish Divergence
This happens when the price makes a higher low ( HL ), but the oscillator tool shows a lower low ( LL ). Think of them as W shapes on the Chart patterns to help you remember. It happens when a rise takes a step back.
The example shown below is a screenshot of the XAU/USD (gold) chart. In the picture, the price made a higher low (HL) while the technical indicator showed a lower low (LL). This means there was a difference between the price and the indicator. This difference suggests that the market is likely to start moving up again soon. In simpler terms, it shows this was just a temporary drop in an upward trend.
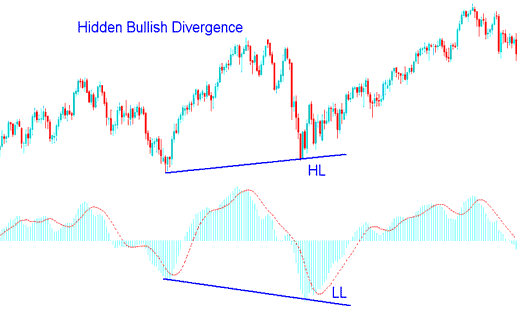
This setup confirms a pullback has ended. It also highlights the strength behind an uptrend.
Gold Hidden Bearish Divergence
This happens when the price makes a lower high (LH), but the oscillator tool shows a higher high (HH). To help you remember, think of them like M shapes you see on chart patterns. It happens after prices go back up a bit in a downwards trend.
The screenshot below shows an XAUUSD gold pattern. Price hit a lower high but the indicator made a higher high. That signals divergence between price and tool. The down trend will pick up soon. It means a pullback in the fall.
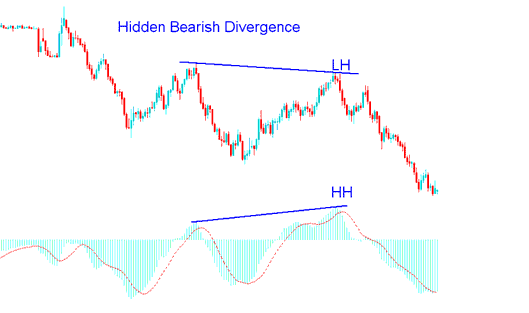
This serves to validate that a price retracement phase has concluded and indicates the underlying momentum supporting a downward trend.
Other frequently utilized indicators include the Commodities Channel Index (CCI), the Stochastic Trading Indicator, RSI, and MACD: MACD and RSI are generally considered the superior technical indicators.
Note: Hidden divergence is the top pattern to trade. It signals in line with the current trend. This setup offers a strong risk-reward ratio. It gives the best entry point.
Gold traders should pair this setup with tools like the stochastic or moving average. Buy XAUUSD when oversold. Sell when overbought.
Merging Hidden Divergence Patterns with the Moving Average Crossover Technique
A beneficial technical indicator to combine with these setups is the moving average indicator, utilizing the moving average crossover method. This will create an effective strategy.
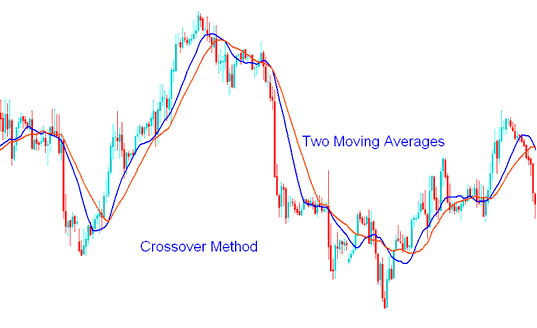
MA Cross over Method
When a trading signal is initially issued (generated), the trader must then verify that the moving average crossover technique corroborates this signal - that is, it must also provide a buy or sell instruction aligning with the same market direction. If a setup involves a bullish divergence between the price and the indicator, the trader waits for the moving average crossover method to generate an upward crossing signal: conversely, for a bearish divergence setup, the waiting period concludes only when the moving average crossover trading strategy produces a downward bearish crossover indication.
By integrating this signal with other analytical tools in this manner, spurious signals (fake outs) during trading can be circumvented.
Combining Together with Fib Retracement Levels
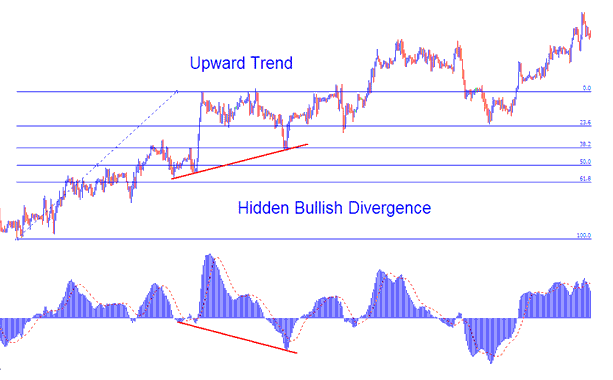
For the purposes of this demonstration, we will examine an upward-trending scenario, utilizing the MACD technical indicator as our focus.
Since the concealed divergence setup simply represents a price retracement within an ongoing uptrend, we can integrate this signal with the Fibonacci retracement levels, which is the most favoured retracement tool. The example illustrated below shows that when this setup materialized on the chart, the price had just reached the 38.20% retracement level. Testing this specific technical level would have presented an optimal juncture to place a buy trade order.
Combining Together with Fibonacci Extension Levels
In the previous example, once the buy trade was executed, a gold trader would need to determine the appropriate take profit level for this trade. To achieve this, a trader must utilize the Gold Fibonacci Expansion Levels.
The Fibonacci extension draws like this on the chart below. It matches the setup shown.
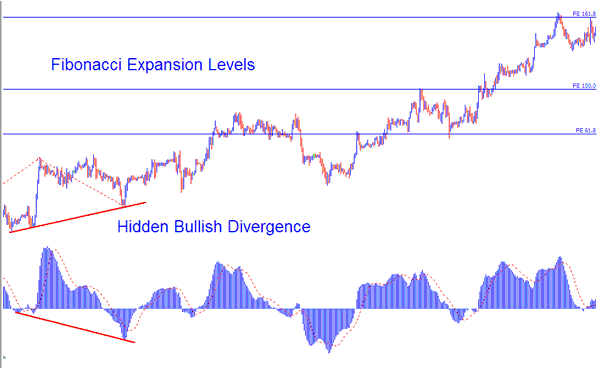
For this example there were 3 take-profit levels:
Expansion Level 61.80% - 131 pips profit
Extension Level 100.00 % - 212 pips profit
Extension Level 161.80 % - 337 pips profit
Using this plan with Fib could be a good way to make money, with clear areas to take profits that are set up this way.
More Courses:
- USDX Chart and How to Trade FX Using US Dollar Indices
- Trading the SX 50 Indices on Both MetaTrader 4 and MetaTrader 5 Platforms
- Guide on Interpreting/Analyzing Pips and Counting Pips Specifically for GBPHKD
- XAUUSD Leverage
- What are the Chandes DMI Forex Buy & Sell Signals?
- How do beginner traders start with NASDAQ100 indices?
- How to Trade Dow Jones30 Guide to DowJones30 Trade Guide Tutorial & Trade Dow Jones Lesson Tutorial
- Instructions on How to Develop an EUR PLN Trading System
- FX Strategy for ASX 200 Stock Index
- Where Can I Get DJI 30 in MetaTrader 4 Software/Platform?

