
Technical Indicators for Setting Stop-loss in Gold Trading
Certain chart-based indicators automate the process of setting stop-loss placements, thereby removing the necessity for XAUUSD traders to perform intricate computations to determine precise stop-loss levels.
XAUUSD systems traders can set stop losses based on chart indicators. Some use math to find the best spot for the stop loss. This sets an ideal way out. Chart indicators guide stop loss placement in XAUUSD trades. They track Gold's price action on the chart. They set limits for Gold's price path. Close open XAUUSD trades if Gold breaks those limits. The price no longer goes that way.
Some of the Trading indicators that can be used to set stop losses are:
Parabolic SAR Indicator
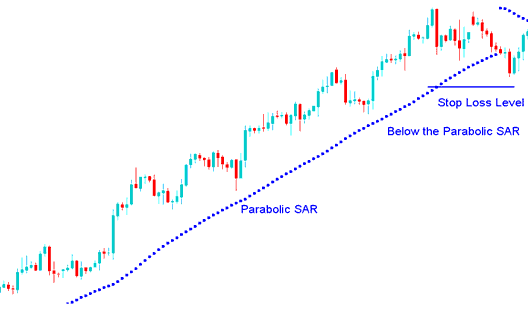
Parabolic SAR Helps Set Trailing Stops for XAUUSD Gold Trades
Parabolic SAR provides excellent points for exit setting and placing stoplosses.
- In an upward trend, you should close long positions when the price falls below parabolic SAR
- In a downward trend, you should close-out short positions when price rises above the parabolic SAR
In a long trade, gold prices stay above the Parabolic SAR dots. The dots shift upward daily, no matter the price direction. How far they move ties to the gold price change.
Parabolic SAR Indicator - Technical Chart Technical Indicator
Parabolic SAR indicator & how it's used for setting stop loss orders
Bollinger Band
The Bollinger Bands indicator employs standard deviations as a measure of market turbulence. Since standard deviation gauges price volatility, the Bollinger bands possess an inherent self-adjustment mechanism: they expand during high-volatility phases and contract when price volatility lessens.
The Bollinger Bands tool has three lines that cover most price moves in a market. The middle line tracks the mid-term trend. It's often a 20-period simple moving average. This line sets the base for the top and bottom bands. Band spacing comes from price volatility. For XAUUSD prices, the bands wrap around the action. Set stop losses just beyond the bands for safety.
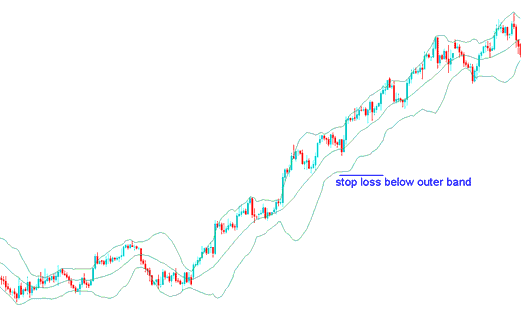
Bollinger Band Indicators Setting StopLoss Level in Gold Price Chart
Fib Retracement Levels Indicator
Fibonacci retracement levels offer support and resistance zones. Traders use them to set stop losses in XAUUSD trades. The 61.8% level is the top choice for stop loss spots. Place the stop just below that 61.8% mark.
The 61.8% Fibonacci retracement level is recommended for locating stop-loss orders, as this particular retracement threshold is seldom penetrated by market action.
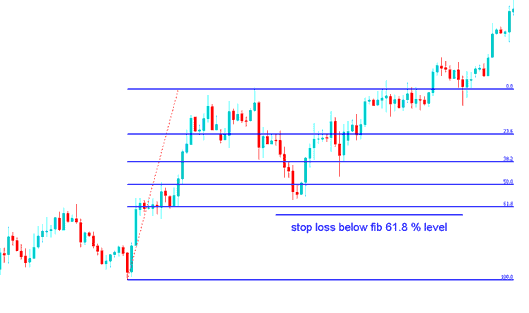
Fib Retracement Levels Chart Indicator Stop Loss Setting at 61.8 Percent Retracement Level
Fib retracement level 61.8% used to set stop orders in XAUUSD trading.
Support & Resistance Areas Lines
Support & resistance zones is another trading chart indicator which can be used to set stoploss order levels where the stop loss orders are set just above or below the support/resistance zones.
Buy Trade - Stop loss set a few pips below the Support Area
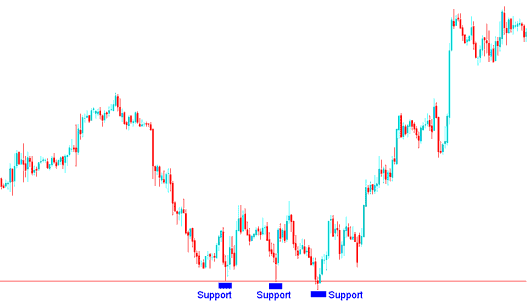
Buy Trade - Stop Loss Order order set a few pips below the Support Area
Sell Trade - Setting a Stop Loss Order Just Above the Resistance Area
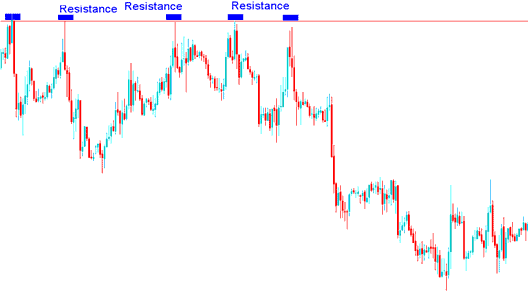
Sell Trade - Stop Loss order set a couple of pips above the Resistance Area
Study More Tutorials & Tutorials:
- Applying the Awesome Oscillator for Trading Analysis in MetaTrader 5
- What's FX Trade?
- How do you find XAG/USD charts on MT4?
- Two XAUUSD Methods Which are Most Commonly Used
- What's FX Chande Trendscore Trading Indicator?
- Trade Dow Jones 30 Index Strategies
- Keltner Bands Automated Forex Automated Expert Advisor
- Finding Suitable Brokers for Nikkei 225 Trading
- Refresher on Technical Analysis Basics