Inverted Hammer & Shooting Star Candlesticks
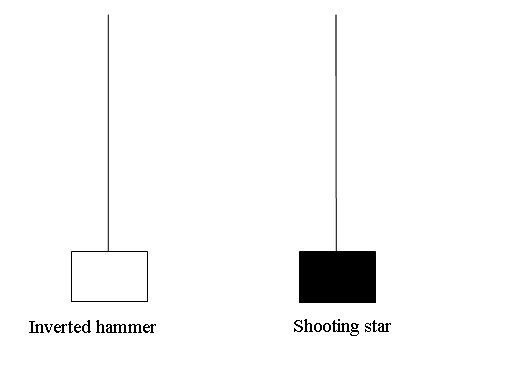
Visually, an inverted hammer candlestick is very similar to a shooting star candlestick. Both patterns feature an extended upper wick and a relatively small body situated towards the lower end of the candle range. The color of these formations is secondary: what truly dictates their meaning is their location - whether they appear at the peak of a market advance (signaling a star) or at the trough of a market decline (indicating a hammer).
The distinction between the two patterns is straightforward: the inverted hammer candle signals a potential shift towards bullish reversal, whereas the shooting star candle signals a potential shift towards bearish reversal.
Upwards Trend Reversal - Shooting Star CandlesDownwards Trend Reversal - Inverted Hammer Candles
Inverted Hammer and Shooting Star Japanese Candles
Inverted Hammer Japanese Candlestick
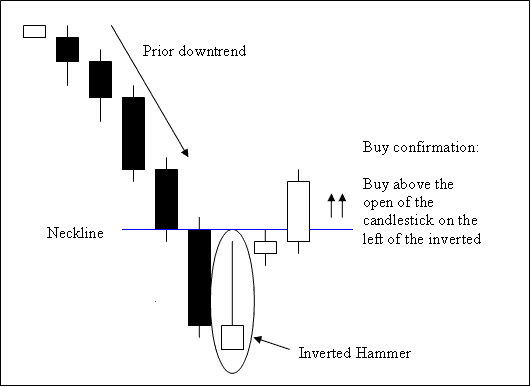
The Inverted Hammer is a sign that the price might go up soon. It appears when the price of gold has been falling. When it shows up after a drop, it could mean the price of gold will start to climb again.
Inverted Hammer Candle Pattern
Trading Analysis of the Inverted Hammer Candle
A buy signal generated based on the inverted hammer candlestick pattern is validated when a subsequent candle forms and closes definitively above the candle's "neckline." This neckline corresponds to the opening price of the candle positioned immediately to the left of the hammer candle, as visually demonstrated above. In this specific context, the neckline functions as a resistance area.
Should the candlestick immediately following the hammer candle fail to close above the established neckline, the trader must then observe the next succeeding candle for a close above that same resistance line. Confirmation of this bullish price reversal setup is secured only upon the appearance of a candle that closes above the neckline.
Stop orders that are waiting for a buy trade to start should be placed just a little bit below the lowest recent price point.
An inverted hammer candle is named as such because it indicates that the market is hammering a bottom.
Shooting Star Japanese Candlestick
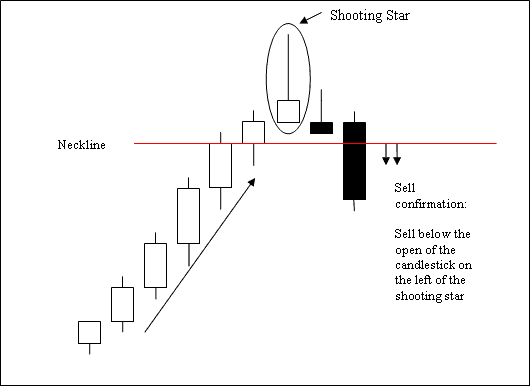
The Shooting Star candle shows that prices might go down. It happens when the market is going up. A Shooting Star candle appears when the price of XAUUSD opens at the same level as its lowest point, then goes up but gets pushed back down to close near where it opened.
Shooting Star Candle Pattern
Analysis of the Shooting Star Candlestick
A sell signal generated using the shooting star candle pattern is confirmed when a new candle closes below the neckline: this is the opening of the candlestick on the left side of the shooting star candle like is shown & displayed on example set-out above. The neck line in this case is a support zone.Stop orders for the sell trade positions opened using this set-up should be placed a few pips above the highest price in the most recent high.
The Shooting Star candle gets its name from appearing at the peak of an uptrend in XAUUSD Gold. It looks like a shooting star in the sky. That's why traders call it that.
Study More Tutorials & Topics:
- Setup guide for the Ehler MESA Adaptive Moving Average (MA) as an Expert Advisor.
- Analyzing the Impact of Fundamental Economic Data Reports on the Forex Market.
- Example HK50 Stock Index Trading Strategy
- Interpretation and analysis of pips on EUR/CHF, including counting pips on EUR/CHF.
- Daily Operating Hours (Open and Close Times) for EURCAD
- MQ5 Bots & EA Expert Advisors
- Download MetaTrader 4 Demo Account
- Strategies for Following Gold Market Trends
- Trading the NIKKEI 225 Stock Index
- How Do I Place T3 Moving Average Indicator in Chart?