
How to Draw TrendLines and Channels in Gold Charts
Sometimes support and resistance areas form diagonally like a staircase. This creates a price trend, which is when the price consistently moves in one direction, either up or down.
You can show this trend with a line on the chart.
A trend line demonstrates points of support and resistance based on price direction. For a market in an upward trend, it identifies support points: for a downward-trending market, it indicates resistance areas. Investors extensively use trend lines to determine these pivotal support and resistance points.
A trendline connects two or more price points. It extends forward as support or resistance. Upward lines slope up. Downward ones slope down. It's a tool in technical analysis to guess future price moves.
A trader who wants to trade Gold metal using trading analysis must know how to draw & interpret the signals derived/generated by this trend-line trading tool.
Trend line analysis works on the idea that gold prices move in trends. Trend-lines show 3 things about the current trend:
- The overall direction of the price - whether up/down
- The power of the current move
- Where future support & resistance areas will likely be located
When a trend line forms, the market usually follows it for a while - either up or down - until it finally breaks. Once that trend line breaks, the price pushes through, dropping below an uptrend or popping above a downtrend.
Mapping out trend channels on Gold charts visually represents the prevailing direction of XAUUSD valuations, which could manifest as either increasing or decreasing.
The illustration below show how to draw trend-lines:
Upward TrendLine
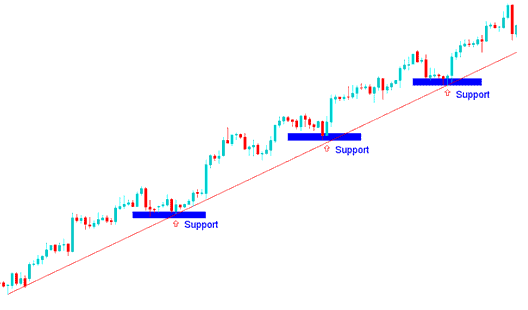
Upward Trendline - Upward Trend of XAUUSD Prices
Downwards Trend-Line
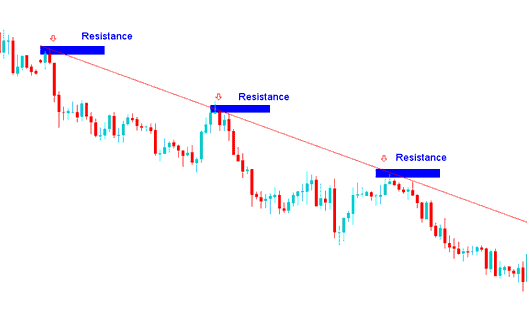
Downward Trendline - Downward Trend of XAUUSD Prices
Draw Trendlines on Gold Charts in MetaTrader 4 Platform
The MetaTrader 4 XAUUSD software includes chart tools to draw trend lines on XAUUSD charts. Gold traders use these tools in the MetaTrader 4 platform, as shown below, to create trend lines.
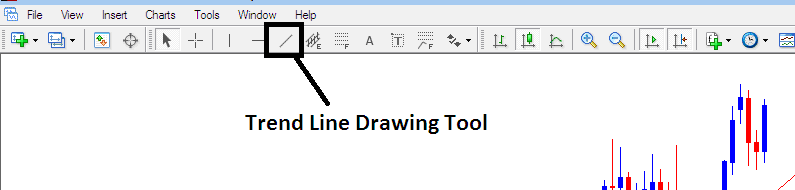
MetaTrader 4 Software Trendline Drawing Tool
To draw trend lines on a gold chart, pick the line tool at the top in MT4 software. Select point A to start the line. Then choose point B where it should hit next. Right-click the line for options. Pick properties. Check the ray box to stretch it out. Uncheck it if you want it to stop. In that same window, switch colors or line thickness on your MetaTrader 4 setup.
"Go with what's popular" is a common phrase among investors because you should never bet against the popular movement. When you trade Gold, following what's popular is definitely the most reliable way to go. Once prices begin to head one way, they usually keep going that way for some time. This is why it gives you the greatest chance of earning money trading Gold online.
Principles of How to Draw TrendLines
- Use candlestick charts to draw trend-lines
- The points used to draw the trend lines are along the lows of the price bars in an upwards trend market. An upwards bullish moving trend is defined by higher highs and higher lows.
- The points used to draw are along the highs of the price bars in a downward trend market. A downward bullish move is defined by lower highs & lower lows.
- The points used to plot trend-lines are extremes points - the high or the low price. These extreme points are important because a close beyond the extreme tells investors & traders that the market trend of the Gold metal prices might be changing. This is viewed as an entry or an exit signal.
- The more often a trend-line is hit but not broken, the more powerful its signal is.
There are two main ways and methods of trading this setup:
- Bounce
- The Break
Trading Analysis of These 2 MethodsWhen the price bounces off the trend line, it means the price will keep moving the same way as before. When the market is moving upward, the price will go up again after touching the support area.
In a downtrend, price hits resistance. Then it drops back from that zone.
The trend line break is a reversal signal where the market moving through the trend line & starts moving in the opposite trend market direction.
If an upward trend is broken, the market feeling changes and becomes negative. If a downward trend breaks, the market feeling changes and becomes positive.
For very strong trends, after the trend-line breaks, the price will stay steady for a while before going the other way. For short trends, this trendline break means the price might change right away.
In Gold metal trading, the times when the trend line bounces and the times when the trend line breaks, which are used in technical analysis charts, depend on these technical levels acting as support and resistance.
Employing Trendlines for Identifying Entry Points, Exit Points, and Setting Protective Stops:
This trend-line method spots good entry and exit points for Gold trades. Place stop losses just beyond the trend lines. The trend-line bounce offers low-risk entries. Use it after price pulls back but stays in the trend. Set trades at trend-line levels. Add a stop loss right above or below the line.
A break in the trend line signals a likely shift in price direction. Once the line breaks, prices start moving the other way. This acts as an early alert for traders to close positions and lock in gains. A clear break through the line means the trend may flip.
Unlike other ways to look at data, there is no set way to figure out trend-lines: setting up a trend-line just means drawing it between two spots on a chart, and a gold trader needs to learn how to make these lines on their charts for trading Gold metal.
Explore Further Directions and Subject Areas:
- How to Analyze Downward XAUUSD Trendline on MetaTrader 4 Gold Charts
- 4 types of Index Divergence Setups
- Instructions for Adding the MetaTrader 4 Bollinger Bands Width Trading Indicator
- Understanding Trading Forex Currency Quotes
- Forex EU 50 Index EU 50 Quote in FX
- Guidance on How to Initiate a Live Trading Account