
Charting Fibonacci Pullback Levels on Gold (XAUUSD) Trends in Both Upward and Downward Directions
The price of gold does not go straight up or down. Instead, XAUUSD's price goes up and down in a zigzag pattern. Fibonacci Retracement is what we use to guess where the zigzag will stop. The pullback spots are 38.2 %, 50%, and 61.8%. These are the points where the market will likely pull back.
What is a retracement? It is a price pullback before the trend continues its main path. Zigzag example: The chart below shows prices rising in a zigzag pattern.
The diagram below shows this movement in an upwards trending market.
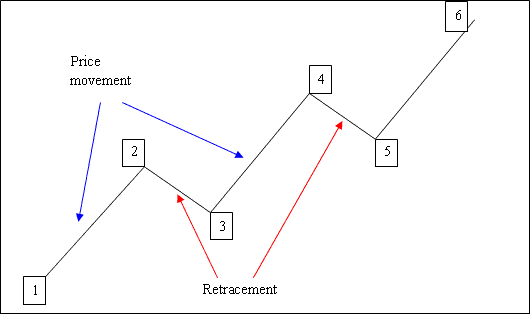
1-2: Price moves up 2-3: Pull-back 3-4: Moves up 4-5: Pull-back 5-6: Moves up
Since we can identify retracement starting points on a Gold price chart, how can we estimate how far these pullbacks will go? The solution lies in using Fibonacci retracement levels.
This is a kind of line study used when trading XAUUSD to guess and figure out the price pullback areas. This xauusd indicator is put right on the price chart in the trading platform your online broker gives you. This Fib retracements indicator will then automatically figure out the pullback levels on the trading chart.
What are the Fib Retracement Levels?
23.6% Fib retracement, 38.2% Fib retracement, 50.0% Fib retracement, 61.8% Fib retracement.
38.2 % & 50.0 % Retracement Levels happen most often & usually the price goes back to these levels - the 38.2 % Fib retracement level is the favorite and most popular one.
The 61.8% Fibonacci retracement level is frequently employed to establish stop losses for trades initiated based on this strategy. This is because, in most circumstances, the price retracement does not extend to reach this specific retracement level.
This Fibonacci retracement instrument will be applied across the charted trajectory of the Gold price movement, consistent with the specifics of the ensuing examples.
How to Mark Fibonacci Retracement Levels on a Chart Showing an Upward Market Trajectory
In the picture below, the XAUUSD Gold price is moving up between points 1 and 2, and then after point 2, it goes back down to the 50.00% Fib retracement level pull back area, and then it keeps moving up in the original and first upwards trend. Notice that this indicator is drawn from point 1 to 2 in the Gold price trend (Upwards trend).
Recognizing that this is merely a retracement or pullback based on our use of the Fib retracement level indicator, we place a buy order between the 38.2% and 50.00% retracement levels, with our stop loss positioned just below the 61.80% pullback level. Had you entered a buy position at this juncture in the trade example below, you would have accrued a significant number of pips as illustrated below.
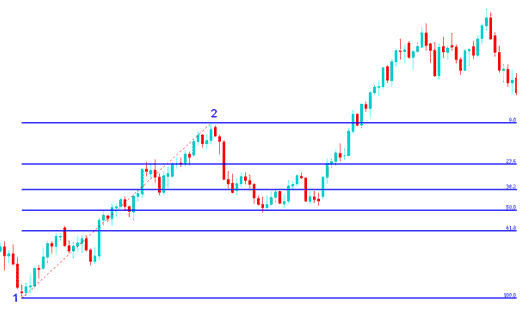
Fib Retracement Levels Drawn on an Upward Gold Market Trend
How does the Fibonacci retracement setup work in the above trade example?
When gold hit the 50 percent Fibonacci level, it found strong support. The price then resumed its uptrend and kept climbing.
23.6 % Fib retracement level affords minimal support and isn't always a perfect vicinity to open an order.
The 38.2% Fib level gives some support. In this case, price fell further to the 50% retracement. Traders often place buy limit orders at that 38.2% Fib spot.
The 50.0% retracement level provided substantial support: in this particular instance, it represented the perfect entry point for initiating a buy order.
Here, the pullback reached the 50% level. Markets often stop at 38.2% though. Traders set buy limits there. They place stop losses just under 61.8% on Fibonacci levels.
How to Draw Fibonacci Retracement Levels in a Downward Trend
In the following diagram, the market displays a downward movement between points 1 and 2 before retracing upwards to the 38.2% Fibonacci retracement level. Subsequently, it resumes its original downward trend. The Fibonacci retracement tool is applied from point 1 to point 2, correlating with the gold price's prevailing downward momentum.
Recognizing this as merely a retracement phase, we place a sell order at the 38.2% Fibonacci retracement level and set a stop loss positioned just above the 61.80% Fibonacci retracement level.
You would have gained a lot of pips if you had placed a sell order at the 38. 2% Fib retracement level, as shown in the trade below. The retracement in this transaction reached the 38. 2% Fib retracement level but not the 50% Fib retracement level. Because the pull-back does not always reach the 50. 00% retracement level, empirical evidence suggests that the 38. 2% Fib retracement level is consistently a good choice when trading Gold metal.
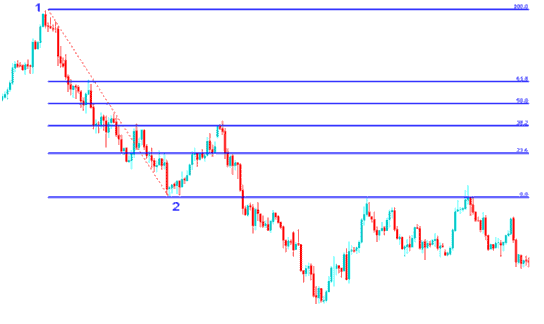
Fib Retracement Levels Drawn on a Downward Gold Market Trend
Fibonacci Retracement Trade Setup Example Explained
The example provided above represents the ideal setup where the price retraces immediately after reaching the 38.2% Fibonacci retracement level.
The Fib retracement level served as a significant resistance point during the price pull-back, making it an ideal position for traders to set a sell limit order, especially as the market declined after reaching the 38.2% Fib retracement. In this scenario, traders would typically place their stop loss at the 61.8% Fib retracement level.
Get More Lessons:
.