Drawing Fibo Extension Levels on Upwards and Downward Trend
We covered Fibonacci retracement before, using two chart points. For expansions, use three points to draw levels.
To establish these levels, we wait until the price retracement concludes, and the XAUUSD metal begins to move in the original direction of the XAUUSD price trend. The point where the price retracement reaches is designated as chart point 3.
The example below marks three points for the Fibonacci expansion indicator. They are labeled 1, 2, and 3. Point 1 starts the market trend. Point 2 shows the pullback and retrace. Point 3 marks the end of that retrace. The chart displays it clearly.
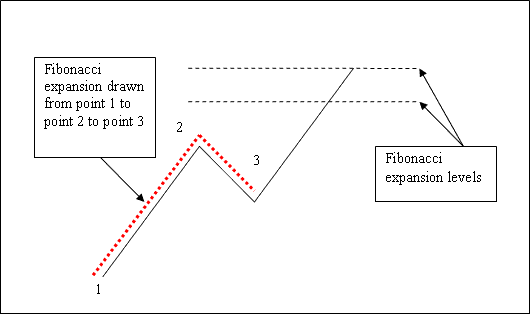
Fibonacci Extension Levels
Remember to note where these Fibonacci expansion levels are placed: they are marked above the technical indicator at the points where the trader will put their profit-taking orders.
Drawing Fibo Extension Levels on an Upward Gold Price Trend
Fibonacci extensions help predict price moves. Key levels are 61.8% and 100%. Traders use them to take profits.
In the example below, you, as someone trading gold, can see that the Fibonacci extension goes the same way as the trend, because the trend goes up - the Fibonacci extension goes up.
These lines are shown on the chart to represent possible spots where profits might be taken. If you had used the 100% line in the example, you would have earned a good amount from buying.
Note: This matches the prior trade where we bought at the 38.2% Fibonacci retracement level. We set take-profit at the 100% Fibonacci extension. Now pull up a gold chart and try these steps.
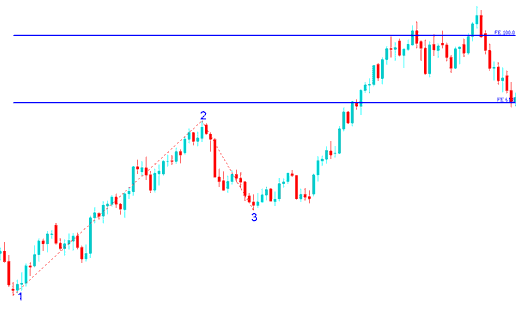
Fib Expansion Levels Drawn on an Upward XAUUSD Price Trend
In the examples above, the upward trend went on, and the Fibonacci Expansion levels of 61.8% and 100.0% were reached. After touching the 100.0% Fib extension level, the price went back down.
Drawing Fibo Expansion Levels on a Downward Gold Price Trend
Given that we utilize this instrument for projecting potential profit targets, how does one accurately plot this in the context of a declining Gold price trajectory?
We plot Fib extension levels trading indicator from point 1 to 2 to three just as is shown below. Remember we always draw this tool in the market direction of the market trend. In the example laid-out below, can you figure out what direction we've drawn it? That is right - downwards because the market trend is downwards.Try & see the difference between how we've drawn it above & how it is drawn below. This time you'd also have used Fib extension level 100%, see just where the price reached. That would have been a good take profit area.
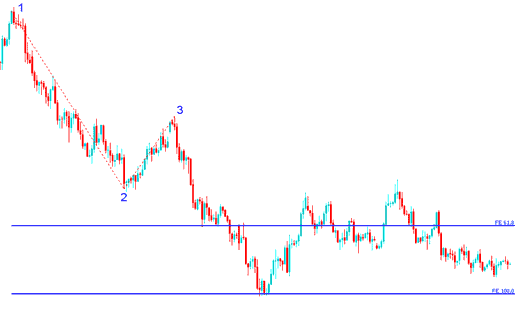
Fib Expansion Levels Drawn on a Downward XAUUSD Trend
Using Fibonacci expansion tools can help plot two critical profit-taking levels - 61.8% and 100%. These levels offer clear horizontal price markers for enhanced chart analysis.
Learn More Tutorials & Topics:
- Gann HiLo Activator Trading Analysis in Forex
- Day Trading Strategy Using the RSI Index
- DeMarks Range Extension MT5 Forex Indicator
- Beginner's Guide: Studying Index Indicators
- Different types of forex accounts - a quick rundown
- How Do I Include CAC in the MetaTrader 5 CAC Phone Trading App?
- Examples of Forex setups when things diverge
- Spinning Tops and Doji Candlesticks Explained
- Setting Dow Jones on the MT5 App
- MACD XAU/USD Indicator Trading Analysis MACD XAU/USD Indicator