MA Convergence/Divergence Technical Analysis and MACD Signals
Developed by Gerald Appel,
The Moving Average Convergence/Divergence (MACD) is one of the most straightforward, reliable, and commonly used indicators.
It is a momentum oscillator and also a trend following indicator.
Construction
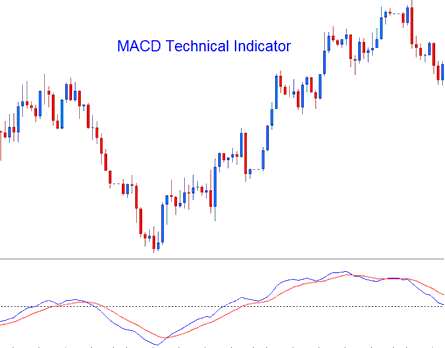
This technical tool works by finding the difference between two averages that move over time and shows that as a "Fast" line. Then, it takes that "Fast" line and figures out a second "Signal" line, which it shows on the same graph as the "Fast" line.
- "Fast" line - Blue Line
- "Signal" line - Red Line
Standard MACD uses a 12-period EMA for the fast line. It pairs with a 26-period EMA. A 9-period EMA on the fast line makes the signal line.
- FastLine = difference between 12 and 26 exponential MAs
- Signal line = moving average of this difference of 9-periods

Technical Analysis and How to Generate Trading Signals
Traders use MACD to follow trends. It shines in spotting moves in rising or falling markets. Key ways to get signals include these three:
XAUUSD Cross-Overs Signals:
FastLine/Signal Line Cross over:
- A buy signal gets derived/generated when Fast-line crosses above Signal Line
- A sell signal gets derived/generated when the Fast-Line crosses below the Signal-line.
But, in a strong trending market, this signal often gives false signals: the best crossover to use is the Zero Line Cross over Signal, which is less likely to give false signals/whipsaws.
Zero Line Cross-over Signals:
- When the Fast-line crosses above the zero center line a buy signal gets generated.
- when the FastLine crosses below zero center-line a sell signal gets generated.
Divergence XAUUSD:
Spotting MACD-price divergences helps find reversals or trend shifts. Two main divergence types occur.
- Classic Divergence Trading Setup Signals
- Hidden Divergence Trading Setup Signals
Over-bought/Oversold Conditions:
MACD is also used to become aware of capability overbought oversold conditions in charge motion movements.
Short MACD lines far from the middle signal overreach. Prices will soon snap back to normal.
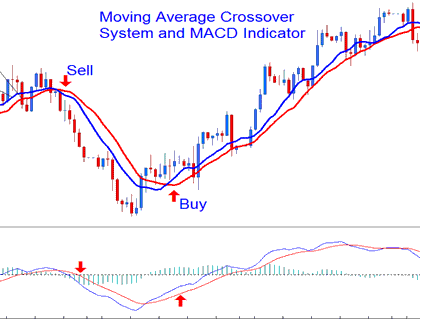
MACD and Moving Average XAUUSD Cross Over Gold System
This special tool can be used with other tools to create a trading plan. It works well with the MA cross-over trading plan. A signal is created when both tools show a signal going in the same direction in the market.

Technical Analysis in XAU/USD
More Topics and Guides:
- Drawing Trendlines Correctly on FX Charts
- How to Find MT4 Silver Chart
- Inertia XAUUSD Tool Analysis on Gold Charts Explained
- A Beginner's Guide to Analyzing XAUUSD Charts
- What's the Value of 20 Pips for Mini Trade Account?
- FX Standard Lot: How Much Does It Cost?
- Ways to Draw the 3 Touch Trend Line Indicator MT4 Platform
