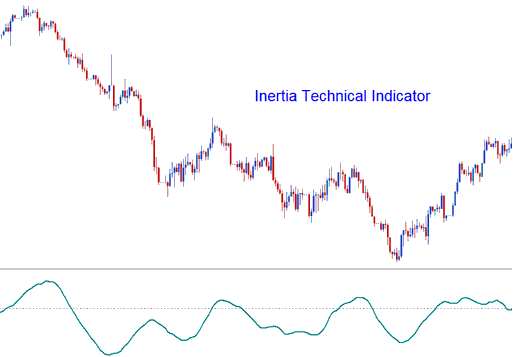
Inertia Technical Analysis & Inertia Signals
Donald Dorsey made it, and it was first used for stocks and commodities, until traders used it to trade other markets with this indicator.
Dorsey titled it "Inertia" based on his view of market behavior. He posited that a market trend is fundamentally a manifestation of inertia: consequently, more energy is needed to alter a prevailing trend than to sustain it. Therefore, the measure of a price trend reflects this market inertia. This technical indicator operates as an oscillator, scaled from zero to one hundred. Trading signals are generated by employing a strategy that involves crossing the central line situated at the 50 mark.

In physics, inertia ties to mass and motion direction. Standard charts show trend direction clear. But mass is harder to measure. Dorsey said volatility fits best for inertia in markets. This idea created the Relative Volatility Index, or RVI. The Inertia indicator uses RVI smoothed with linear regression.
Gold Technical Analysis and Generating Signals
Trading with this indicator is straightforward. Signals are easy to read. Charts below show buy and sell examples using Inertia.
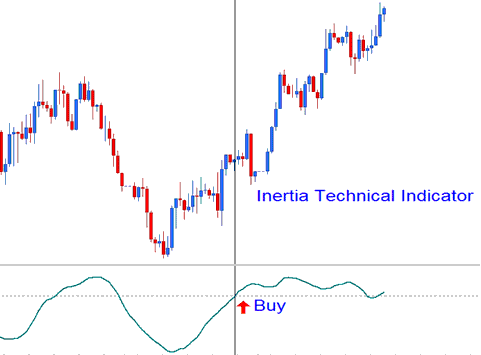
Bullish Buy Trading Signal
If the Inertia number is higher than 50, it means the inertia is positive, and this shows that the long term trend is going up as long as this number stays above 50. If the number goes down to below 50, it is seen as a signal to sell and stop trading. The picture here gives an example of how a signal to buy is made.

Upward Trend - Bullish Signal
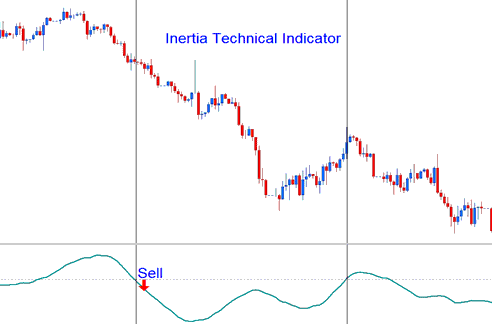
Bearish Sell Signal
When the Inertia indicator falls below 50, it indicates negative inertia, suggesting a long-term downward trend as long as the indicator stays below 50. A crossover above 50 then serves as a signal for exiting trades. The accompanying chart demonstrates how a sell trade signal is generated.

Downwards Trend - Bearish Signal
Study More Tutorials & Courses:
- Using the Alligator Tool in the MetaTrader 4 Trading Software
- Keltner Bands MT4 Indicator Shown
- Buy/Sell Signals Generated by RSI Indicator Cross-overs on MT5
- How Do I Place S&P in the MT5 S&P App?
- Drawing Fib Extension Levels on Upward and Downward Trend
- Hull Moving Average MT5 Indicator Analysis in Trading Charts
- Executing Index Trades using the MetaTrader 4 iPhone Application
- 100 Pips Value – Micro Account Breakdown
- Gold Leverage Utilization
- MT4 Parabolic SAR Indicator for Day Forex
