RSI Technical Analysis and Relative Strength Index Signals
The RSI indicator was developed by J. Welles Wilder.
The RSI is a very popular oscillator & useful momentum oscillator. RSI compares a Forex currency magnitude of recent gains against its magnitude of recent losses and quantifies this information into a value that ranges between 0 and 100.
Explanation
There are several popular techniques of interpreting, some of which include:
RSI FX Trading Divergence:
Looking for divergences between the RSI and forex price can prove to be very effective in identifying potential reversal points in forex price movement. Trade long on Classic Bullish Divergence: Lower lows in forex price and higher lows in the RSI; Trade short on Classic Bearish Divergence: Higher highs in forex price and lower highs in the RSI. These types of divergence are often indications of an impending reversal.
RSI Overbought Oversold Levels:
The RSI can be used to identify potential overbought and over-sold conditions in forex price movements. An Overbought condition is generally described as the RSI being greater than or equal to the 70% level while an oversold condition is generally described as the RSI being less than or equal to the 30% level. Trades can be generated when the RSI crosses these levels. When the RSI crosses above 30 a buy signal is given. Alternatively, when the indicator crosses below 70 a sell signal is given.
RSI 50-level Forex Trading Crossover:
When the RSI crosses above 50 a buy signal is given. Alternatively, when the RSI crosses below 50 a sell signal is given.
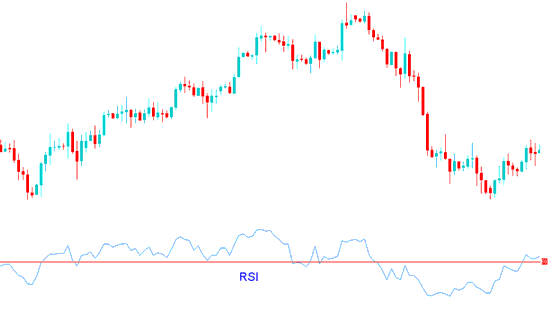
RSI


