Consolidation Pattern Setups in XAUUSD
The market can shift in any direction with bilateral/consolidation chart patterns. Gold price charts display 2 kinds of consolidation patterns:
- Symmetric Triangles - Consolidation chart patterns
- Rectangles - Range/ranging market
Symmetrical Triangles - Consolidation Chart Patterns
Symmetric triangles are commonly referred to as consolidation patterns.
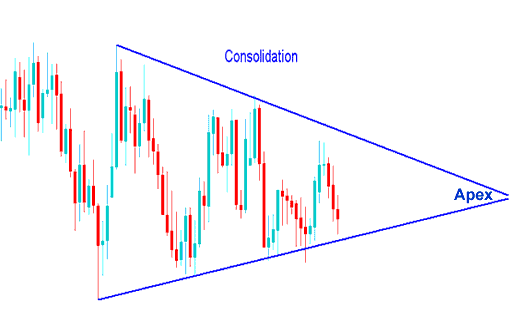
Symmetric triangles show up on charts as trendlines coming together, marking a period where the market's just hanging out. If the price breaks up through the triangle, that's your buy signal. If it breaks down, that's your sell. Usually, the market breaks out before the triangle closes all the way to the tip.
XAUUSD Price Trend-lines can be charted by connecting the troughs and peaks formed during a period of price consolidation: the resulting lines are symmetrical and converge toward an apex. A definitive price movement outside this boundary, known as a breakout, is reasonably expected to occur when the chart pattern has moved between 60% and 80% of the way towards this apex. Breaks occurring significantly earlier or later than this range carry a higher risk of being false breakouts and are thus less dependable. Following a successful breakout, the apex area establishes new support and resistance levels for the instrument's price. The price that has broken out should ideally not retreat back across the apex boundary. This apex point is commonly utilized as the designated area for setting protective stop-loss orders on open Gold positions.
When these consolidation chart patterns form we say that the Gold market is taking a break prior to deciding next trend direction to move.These consolidation chart patterns form when there is a tug of war between the buyers and the sellers and the market can not decide which way to move.
Consolidation Setup
This pattern won't last forever. Like in a tug-of-war game, one side always wins in the end. Check the price chart below. The consolidation phase broke out and headed in one clear direction. So, how do we pick the winning side?
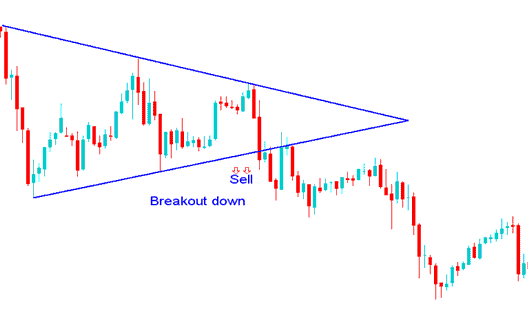
Consolidation Pattern Analysis - Downward Breakout Scenario - A Sell Trade Signal generated following a Consolidation price formation.
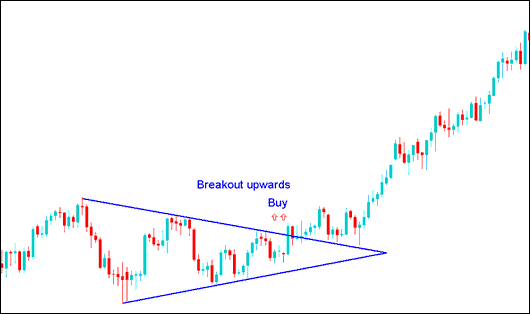
Consolidation Pattern - Breakout Upwards - Buy Signal after a Consolidation Setup
Returning to our central query: how do we position ourselves for potential gains? The approach involves monitoring the Gold price action until it decisively moves beyond one of the established lines, at which point buy or sell orders are placed ensuing that direction. Specifically, following a period of consolidation, initiating a buy if the price breaches the upper line, or a sell if it breaks beneath the lower line, is the strategy.
Alternatively if you don't want to wait out the consolidation, you can use pending orders. If you would like to know more about pending orders go to the course: Stop Entry Order Types
The 2 types of stop order types used to trade consolidation chart patterns are:
Buy Entry StopAn order to open a buy at a price level that is above market price
Sell Stop Entry: An instruction to initiate a short sale at a price level situated beneath the current market rate.
These are orders to open buy above the market or to open a sell below the market.
Rectangle Setup
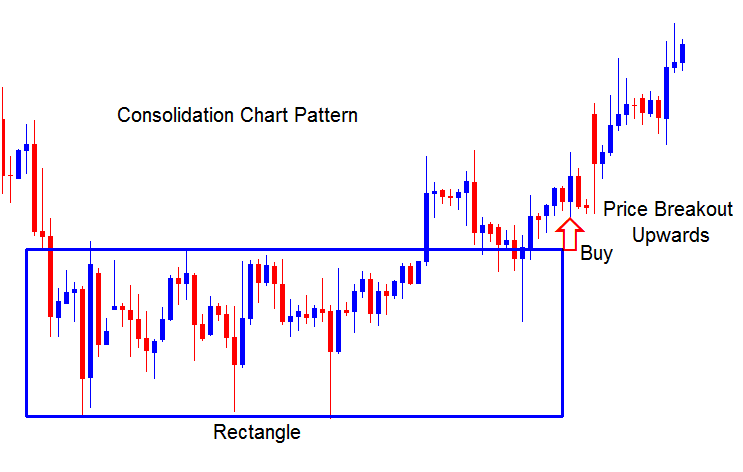
A rectangle consolidation pattern setup is a trading range with narrow price action that forms a consolidation period in Gold prices market. The range is defined by two parallel trendlines which are horizontal and indicate the presence of support & resistance. This setup is drawn on a chart using a rectangle, hence its name rectangle chart pattern.
For this setup where things stay steady, prices make several highs and lows that can be linked with flat lines that are next to each other. This pattern takes shape over a long time, giving the pattern its rectangle form.
The price moves out from this waiting pattern when either of the lines is broken and the area of the rectangle is passed. When price goes upwards, it's a signal to buy. When price goes downwards, it's a signal to sell.
Rectangle Chart Setup
The gold price breaks out of the consolidation range after a period and continues to ascend following an upward market breakout.
Study More Courses & Courses:
- How Do You Trade When a Pattern Keeps Going?
- Programming MT4 MetaEditor Tutorial Lesson: Adding MT4 Custom Trading Indicator
- Guide to Installing the Nikkei Instrument on the MT4 Android Trading App
- How to Become a Better Trader Through Trade Forex Psychology
- How to Figure Out Forex Pip Values for Regular Forex Accounts
- How to Trade with the Coppock Curve Indicator in MetaTrader 5
- Support and Resistance Level Analysis within MT5
- What's SMI20 Strategy?