How to Add Coppock Curve Indicator on MetaTrader 4 Charts
Step 1: Open Navigator Window on FX Trading Platform
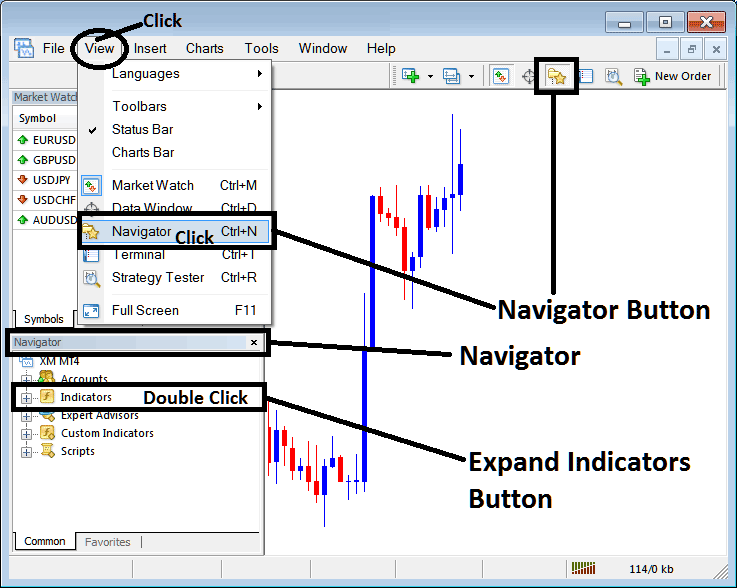
Open Navigator window as shown & illustrated below: Go to 'View' menu (click on it), then select 'Navigator' window (click), or From Standard Tool Bar click the 'Navigator' button or press keyboard short cut keys 'Ctrl+N'
On Navigator window, choose 'Indicators', (Double-Click)
How to Add Coppock Curve Indicator on MetaTrader 4 - MT4 Coppock Curve Indicator
Step 2: Expand the Indicators Menu on the Navigator - Adding Coppock Curve MT4 Indicator
Expand the menu by clicking the expand button marker (+) or double click the 'indicators' menu, after this the button will appear as (-) and will now display a list as shown below - select the Coppock Curve forex chart indicator from this list of forex indicators so as to add the Coppock Curve indicator on the forex chart.
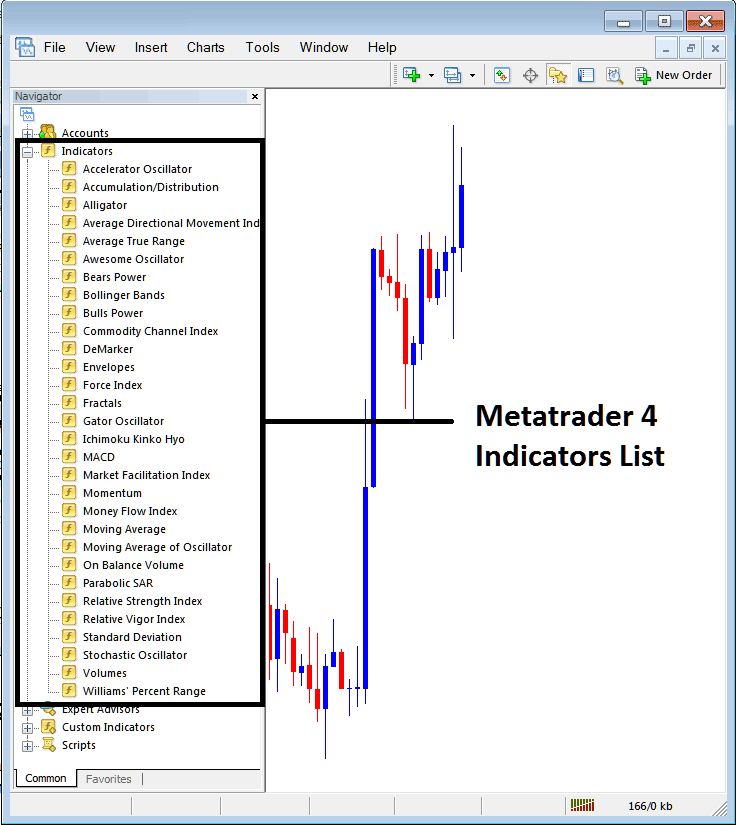
How to Add Coppock Curve Indicator - From the Above window you can then place Coppock Curve indicator that you want on the Forex chart
How to Add Custom Coppock Curve Indicator to MT4
If the technical indicator you want to add is a custom indicator - for example if the Coppock Curve technical indicator you want to add is a custom indicator you will need to first add this custom Coppock Curve indicator on the MT4 platform & then compile custom Coppock Curve indicator so that the newly added Coppock Curve custom indicator pops up on the list of custom indicators in MetaTrader 4 software.
To learn how to install Coppock Curve indicators on MT4, how to add Coppock Curve indicator window to MT4 and how to add Coppock Curve custom indicator in MT4 - How to add a custom Coppock Curve indicator in MT4.
About Coppock Curve Technical Indicator Tutorial Explained
Coppock Curve Technical Analysis and Coppock Curve Signals
Created by Edwin Sedgwick Coppock
This technical indicator was used for technical analysis of Stocks & Commodities in the beginning but was later used to trade Forex.
The principle behind this is the psychology of trading, based on the theory that human habit is predictable. And price movement always oscillates in a zigzag manner.
The principle of adaptation-level applies to how price reacts at certain levels, stock and currency prices will react in the same way or pattern as those observed historically.
FX Technical Analysis & Generating Signals
In Forex trading, The moving average is the simplest form of an adaptation-level, the price will oscillate around the moving average. This forms the basis of this indicator, which is a longer term oscillator based on this adaptation-levels(moving average), but in a different way.
Oscillators usually begin by calculating a % change of the current price from some previous price point, where the previous price point is the reference point (adaptation-level).
Edwin Coppock reasoned that the market participants' emotional state could be quantified by summing up the % changes over the recent past to get a general sense of the market's longer term momentum.
For example, If we compare prices relative to a year ago and we see that this month the market is up 20% compared to a year ago, last month it was up 15% over a year ago, and 10 %, 7.5% & 5% respectively the months before that, then we may determine that the market is gaining momentum.
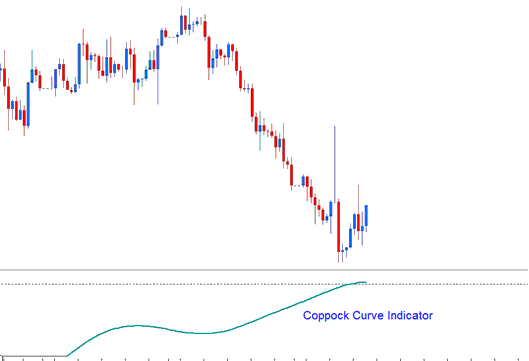
Basic signals can also be generated using the Coppock Curve to trade market reversals from extreme price levels. Looking for divergence and trend line breaks may also be combined to confirm the signal.
Implementation
The input levels of this indicator might need to be adjusted to better fit the dynamic nature of the forex currency markets trading.
Coppock Curve has a zero line reference point, but this doesn't represent the adaptation-level but it is only a visual reference point only.


