Support & Resistance Technical Analysis along with Support and Resistance Signals
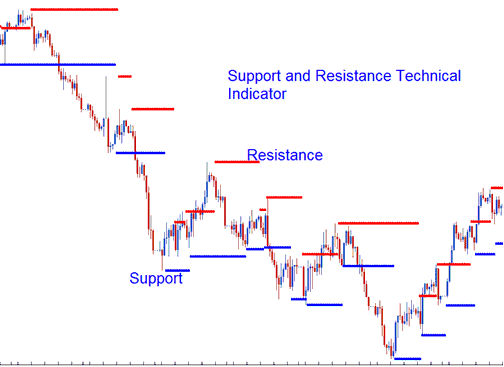
Support and Resistance are fundamental concepts within Forex trading, with traders typically marking these levels with horizontal lines.
Furthermore, an indicator exists that automatically plots these critical levels and highlights both resistance and support zones.

When it comes to these technical levels price can either bounce off these levels or break these technical levels.
When a resistance level is breached, the price will rise, and that resistance will convert into support.
Should the price successfully breach a recognized support level, subsequent movement is expected to trend lower, and that broken support level will reform as a resistance point.
Support levels show where most investors think prices will rise. Resistance levels mark spots where many traders expect prices to drop.
After price breaks support or resistance, it often keeps going that way. It heads to the next level.
When a level of support or resistance is tested or touched by the price and bounces off it often, that specific level becomes more important.
Technical Analysis and How to Generate Trading Signals
The trendlines approach is used to determine these values.
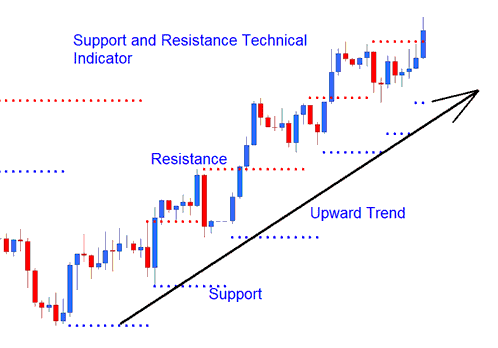
Upward Trend
In an uptrend, support and resistance levels slope upward.

Upward Trend
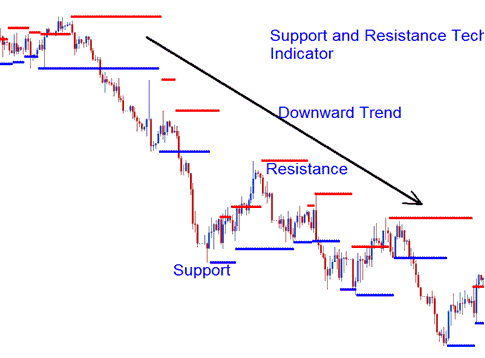
Downwards Trend
In a downtrend, support and resistance levels slope downward.

Downward Trend
Explore Further Subject Areas and Programs:
- Keltner Bands for Forex Buy/Sell Trade Signals
- How to Set CAC40 Index in MT5 Platform
- Support and Resistance Levels MT5 Technical Analysis
- HSI 50 System
- Definition of a Forex Cent Lot Explained
- What is the Method to Trade a Market on MetaTrader 4 Platform?
- Learn Forex Tips for Successful Trading
- MetaTrader 4 Online XAU USD MetaTrader 4 Brokers
- Accumulation/Distribution MT5 Analysis Forex Trade Signals
- Trading the FTSE100 index on MetaTrader 4 and MT5 platforms.
