Stochastic Momentum Index Commodity Trading Technical Analysis & Stochastic Momentum Index Trading Signals
Developed by William Blau.
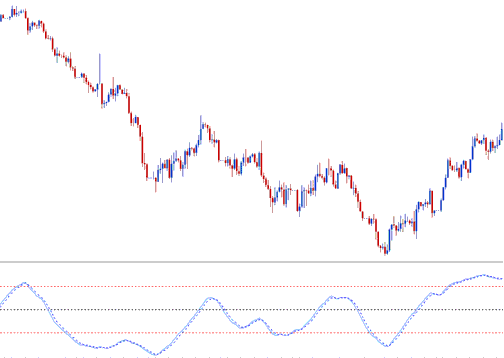
The Stochastic Momentum Index, SMI indicator is an adaptation of the classic Stochastic Oscillator technical indicator which smoothes out the stochastic oscillations.
Construction of Stochastic Momentum Index Indicator
This commodity technical indicator is calculated by comparing the commodity price relative to the average of an n number of periods.
Then instead of plotting these values directly, smoothing using an Exponential Moving Average is applied & then the values drawn to form the SMI.
When the closing commodity price is greater than the average of the range, the SMI will move upward.
When the closing commodity price is less than the average of the range, the SMI will move down.
This oscillator ranges between the values of +100 & -100, this indicator is also less prone to whipsaws compared to the stochastic oscillator.
Commodity Analysis & Generating Trading Signals
Buy & Sell Commodity Signals/ Crossover Signals
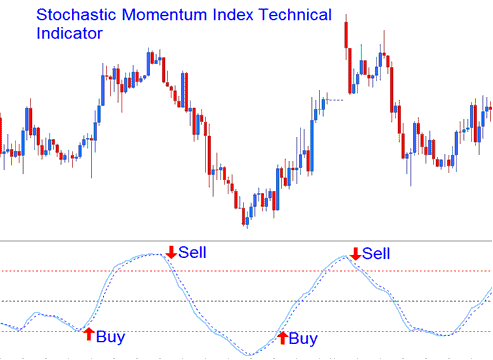
The Stochastic Momentum Index can be used to generate buy & sell signals using the method illustrated below, Buy when the SMI is moving upward and sell when its heading downward.
Buy & Sell Commodity Signals/ Crossover Signals
Overbought/Oversold Level Commodity Trading Crossovers
- Overbought levels above +40
- Oversold levels below -40
Buy signal is generated when this oscillator falls below oversold level & then rises above this level & starts to move upward.
Sell Commodity Signal is generated when this oscillator rises above overbought level & then falls below this level & starts to move downwards.
Divergence Commodities Trading
The example shown below shows a bearish classic divergence between the commodity price & the SMI. When the Stochastic Momentum Index showed this divergence the commodity price trend reversed and started to move in a downward direction.
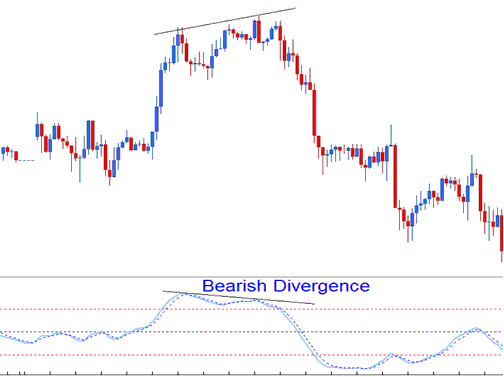
Bearish Commodity Trading Divergence