Bollinger Bands Strategy
- How Bollinger Bands Works
- Bollinger Bands Market Volatility Analysis
- Bollinger Bands Bulge and Squeeze
- Bollinger Bands Commodity Trading Price Action in Trends
- Bollinger Bands Commodity Trading Price Action in Range
- Bollinger Bands and Trend Reversals
- Bollinger Bands Commodity Trading Strategy Summary
Bollinger Bands Commodities Indicator Strategy
Bollinger Bands indicator acts as a measure of volatility. Bollinger Bands indicator is a commodity price overlay indicator.
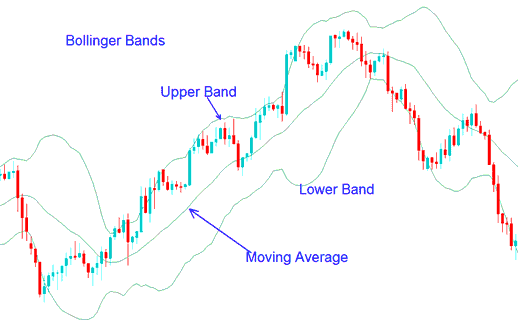
Bollinger Bands indicator consists of 3 lines or bands: the middle band (moving average), an upper band a lower band. These 3 bands will enclose the commodity price & the commodity price action will move within these three bollinger bands.
Bollinger Bands indicator forms upper and lower bands around a moving average. Default moving average for bollinger bands commodity indicator is the 20-SMA. Bollinger Band commodity indicator use the concept of standard deviationss to form their upper & lower Bands.
The example of Bollinger Bands indicator is shown below.
Bollinger Bands Commodities Indicator - How to Trade Commodity Trading with Bollinger Band Strategy
Because standard deviation is a measure of commodity price volatility and volatility of the commodities trading market is dynamic, the commodity trading bollinger bands keep adjusting their width. Higher commodity price volatility means higher standard deviation and the more the bollinger bands widen. Low commodity price volatility means the standard deviation is lower and the bollinger bands contract.
Bollinger Bands forex indicator use commodity price action to give a large amount of commodity price action movement information. The commodity price information given by the this bollinger bands commodity indicator includes:
- Periods of low volatility- consolidation phase of the commodities trading market.
- Periods of high volatility - extended trends, trending commodity markets.
- Support and resistance levels of the commodity price.
- Buy and Sell points of the commodity price.