Keltner Bands Commodity Trading Technical Analysis & Keltner Bands Trading Signals
Developed by Chester Keltner. Described in his book "How to Make Money in Commodities Trading"
Keltner Bands are based on ATR technical indicator, the bands use ATR values to draw the bands lines.
These Bands form Channels that help to identify the Commodity market trends using this simple volatility channel.
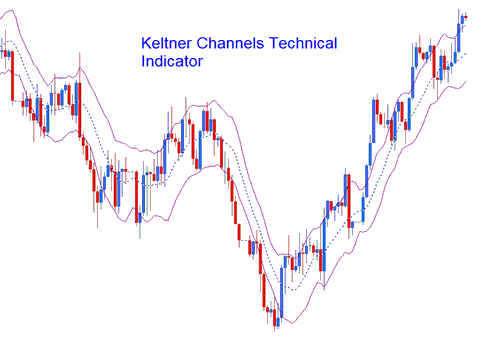
Keltner Bands
Construction
Keltner Channels are similar to Bollinger Bands except for the fact that Bollinger Bands use standard deviation technique to determine market volatility & to draw the bands.
For the keltner bands instead of using the standard deviation the average true range (ATR) measure of volatility is used.
This commodity technical indicator is an n number of periods exponential moving average of the closing commodity price. These bands are created by
Adding (for the upper line) and
Subtracting (for the lower line)
An (n period simple moving average of an n-period ATR) * an ATR multiplier.
Commodities Trading Technical Analysis & How to Generate Signals
This commodity technical technical indicator can be traded in much the same way as a Bollinger Bands
Continuation Trading Signals
When commodity price moves outside the bands then a continuation of the current commodity trend is implied. A buy signal is when the channels are moving upwards and sell signal is when the channels are moving downwards
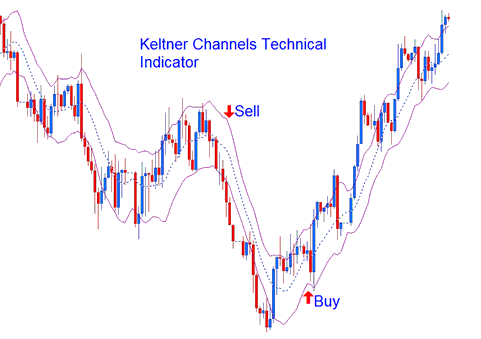
Continuation Buy Sell Trading Signals
Reversal Commodity Signals - Double Tops and Double Bottoms
Tops and Bottoms made outside the bands followed by tops and bottoms made inside the Keltner channels indicate signal for reversals in the commodities trading market trend.
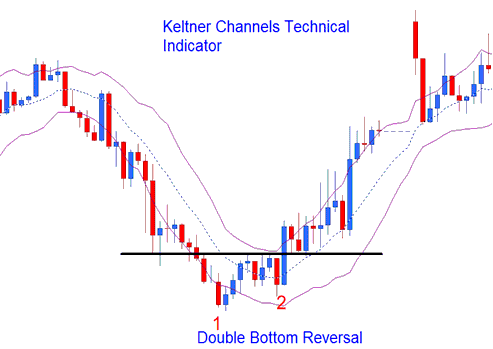
Reversal Trading Signals
Ranging Commodity Trading Markets
In range markets a move which originates from one Keltner channel tends to go all the way to the other channel.