Trailing Stop Loss CFDs Order Levels CFD Technical Analysis and Trailing Stop Loss CFDs Order Levels CFD Signals
Developed by Tushar Chande.
This is a volatility based indicator that is used to estimate levels to set stop-loss levels. The distance at which it estimates the trailing stop level is decided based on market volatility.
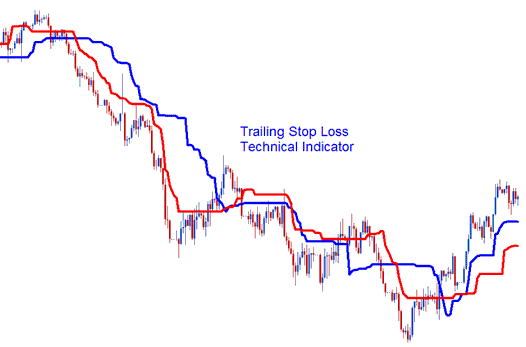
The Levels of the 2 lines, these 2 lines represent:
- Long Stop Level - Blue Line
- Short Stop Level - Red Line
Long stop level line has much wider range in terms of where it trails the stop loss as compared to short stop level that implements a tight stop loss.
This cfds technical indicator is volatility based when it comes to trailing and following the cfd price action. Trailing Stop Levels will trail the above the cfd price in a downward market cfd trend and trails below the cfd price in an upward market trend.
CFDs Technical Analysis & Generating CFD Signals
These will be calculated using volatility to calculate where to draw the indicator - this is used to figure out what levels to set stop losses.
Upward CFDs Trading Trend
In an upward cfd trend these levels will follow below the cfd price. The trader can use either the short stop level line to set up a tight stop or the long stop level to set a stop loss that is not very tight. As the cfd price goes higher the trailing level also goes higher. An exit signal is generated when price crosses below these levels.
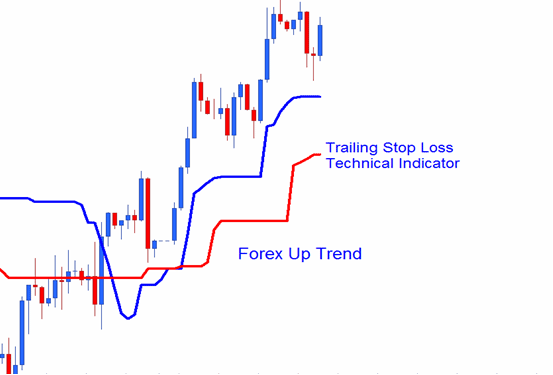
CFD Trading Uptrend
Downwards CFD Trading Trend
In a downward cfd trend the stop loss levels will trail above the cfd price this two levels can be used to set these levels. As the cfd price drops further these levels will continue to drop lower and follow the cfd price lower. An exit signal is generated when price crosses above these levels.
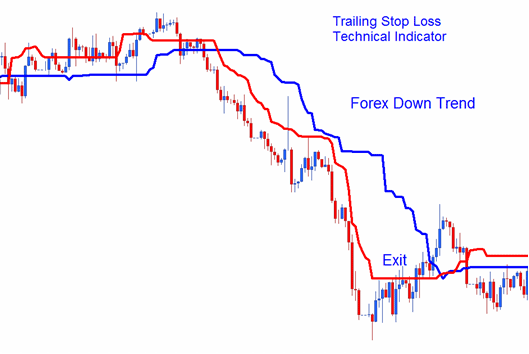
CFD Trading Downtrend
When cfd price starts to retrace these levels will not retrace but will remain at their levels, this will mean at some point the trade will be closed by the trailing stop loss.


