ADX CFDs Technical Analysis and ADX CFD Signals
Developed by J. Welles Wilder
This a momentum indicator used to determine the strength of a cfd price trend: it's derived from the DMI - Directional Movement Index which has 2 lines.
+DI - Positive Directional Movement Index
–DI - Negative Directional Movement Index
ADX is calculated by subtracting these 2 values & applying a smoothing function.
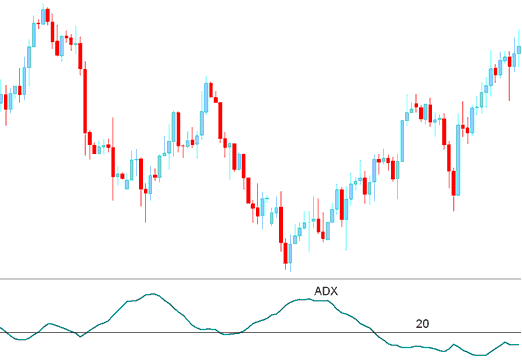
The ADX isn't a directional technical indicator but a measure of the strength of the cfd trend which has a scale of Zero to 100.
Higher the technical indicator value the stronger the trend.
A value of below 20 indicates that the cfd market is not trending but heading in a range.
A value of above 20 confirms a buy or sell signal & indicates a new cfd trend is emerging.
Values above 30 indicates a strong trending market.
When ADX indicator turns down from above 30, it indicates that the current cfd trend is losing momentum.
Directional Movement Index Indicator
Since the ADX alone is a directionless indicator it is combined with the DMI index to figure out the direction of the cfd.
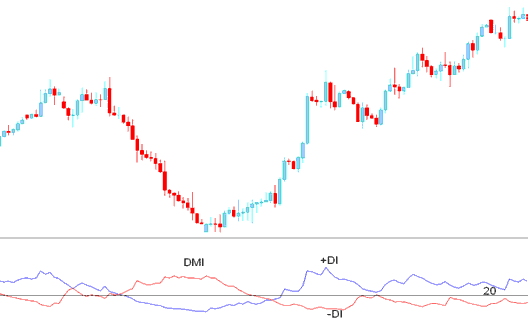
DMI
ADX and DMI Index
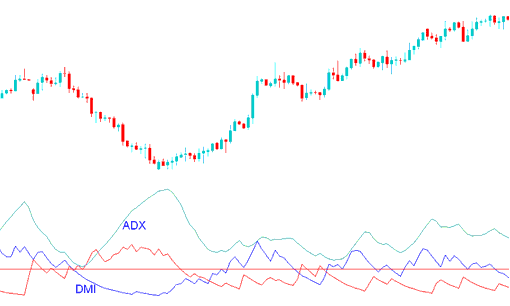
When the ADX is combined with DMI index a trader can determine the direction of the trend and then use the this indicator to determine the momentum of the prevailing cfd trend direction.
CFD Technical Analysis & Generating CFDs Signals
Buy CFD Signal
A buy trading signal is generated when +DI is above –DI, and the ADX technical indicator is above 20
The Exit signal is generated when indicator turns down from above 30.

Buy CFDs Signal
Sell CFD Signal
A short signal is generated when –DI is above +DI, and the ADX technical indicator is above 20
The Exit signal is generated when indicator turns down from above 30.
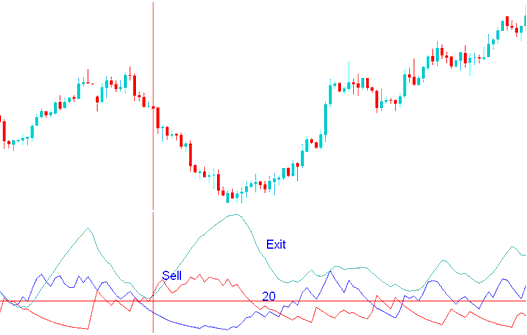
Sell CFDs Signal


