RVI CFD Technical Analysis and RVI CFD Signals
Developed by John Ehlers
The RVI combines the older concepts of technical analysis with modern digital signal processing theories and filters to create a practical & useful indicator.
The basic principle behind it is simple –
- CFD Prices tend to close higher than they open in up-trending markets &
- CFD Prices close lower than they open in down-trending markets.
The momentum (vigor) of the move will therefore established by where the prices end up at the close of the candlestick. The RVI plots two lines the RVI Line and the signal Line.
The RVI index is essentially based on measuring of the average difference between the closing and opening cfd price, and this value is then averaged to the mean daily trading range & then drawn.
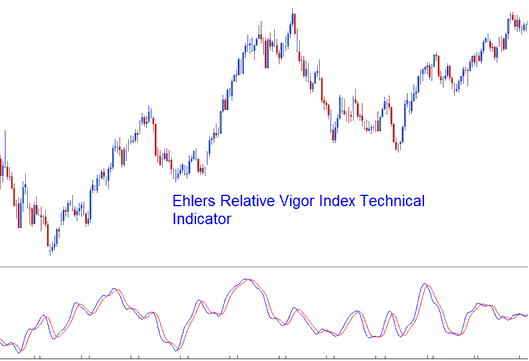
This makes the index a responsive oscillator that has quick turning points which are in phase with the cfd market cycles of cfd prices.
CFD Technical Analysis & Generating CFDs Signals
The RVI is an oscillator. The basic method of interpreting the index is to use the crossovers of the RVI & the Signal Line. Signals are generated when there is a crossover of the 2 lines.
Bullish Signals - a buy signal occurs when the RVI crosses above the Signal-Line.
Bearish Signals - a sell signal occurs when the RVI crosses below the Signal-Line.
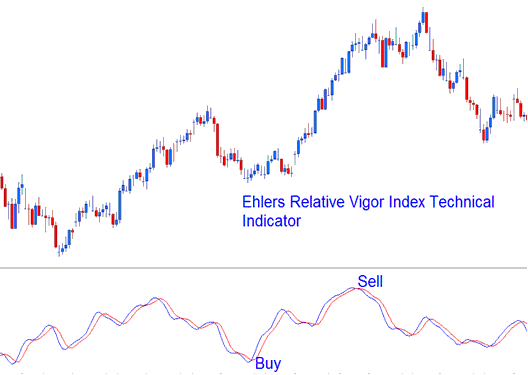
Buy and sell signals generated using the cross over technique


