How to Add CFDs Indicators in MT4 Charts - Adding MT4 CFDs Chart Indicators
Step 1: Open Navigator Window Panel on CFD Trading Software
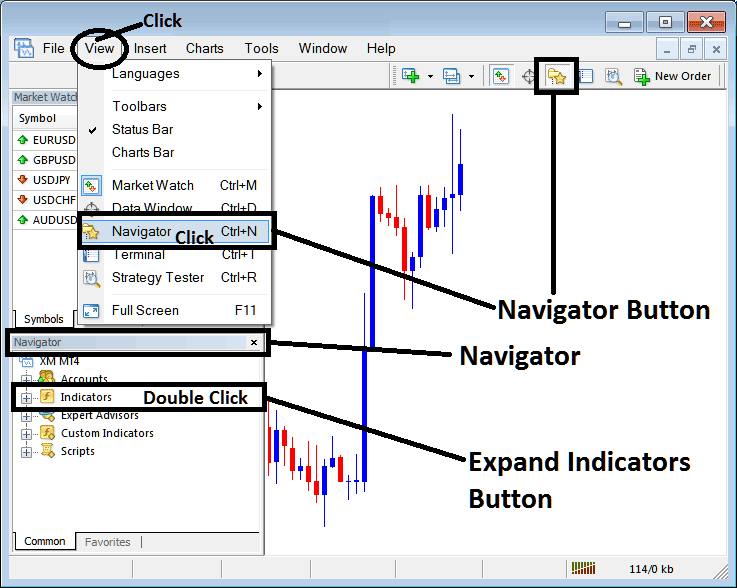
Open Navigator window panel as illustrated below: Navigate to 'View' menu (click on it), then select 'Navigator' window panel (click), or From Standard Toolbar click the 'Navigator' button key or press keyboard shortcut key 'Ctrl+N'
On Navigator window, choose 'Technical Indicators', (Double-Click)
How to Add Indicator in MT4 - MT4 Indicator - CFDs Indicators MT4
Step 2: Expand the CFDs Indicators Menu on the Navigator - Adding CFDs MT4 Indicator
Expand the menu by clicking the expand button marker (+) or double click the 'indicators' menu, after this the button will appear as (-) and will now display a list as shown below - select the CFDs chart indicator from this list of cfds indicators - CFDs Indicators MT4 - so as to add the CFDs indicator on the cfd chart.
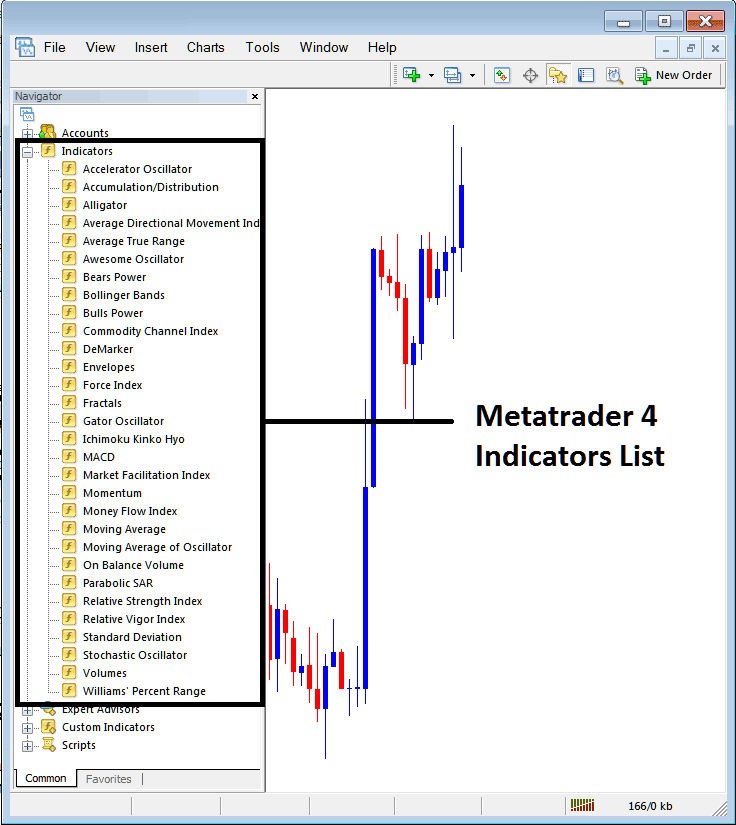
How to Add Indicator - From the Above window you can then place CFDs indicator that you want on the CFDs chart - CFDs Chart Indicators Explained.
How to Add Custom Indicator to MT4
If the technical indicator you want to add is a custom indicator - for example if the technical indicator you want to add is a custom indicator you will need to first add this custom CFDs indicator on the MetaTrader 4 software & then compile the custom CFDs indicator so that the newly added CFDs custom indicator pops up on the list of custom indicators on the MT4 platform - Custom CFDs Indicators MT4.
CFDs Chart Indicators Explained - To learn how to install CFDs indicators on MT4, how to add CFDs indicator window to MT4 and how to add CFDs custom indicator in MT4 - How to add a custom Indicator on MetaTrader 4.
About MT4 Indicators Technical Indicator Tutorial PDF - CFDs Indicators Explained
CFDs Indicators List and CFDs Chart Indicators Explained
To learn CFDs trading technical analysis the first thing which a trader should do is to know about all the different cfds chart analysis indicators & then try to find the cfds indicators that they can use.
A
- Acceleration/Deceleration: AC
- Alligator
- Aroon
- Aroon Oscillator
- Awesome Oscillator
- Accumulation/Distribution
- ADX
- Average True Range (ATR)
B
- Bollinger Bands: Fibonacci Ratios
- Bears Power
- Bollinger Bands Indicator
- Bollinger Bandwidth
- Bulls Power
- Balance of Power
- Bollinger Percent B or %b
C
- Chaos Fractals
- Chande Q-Stick
- Choppiness Index
- Chande Trend Score
- Coppock Curve
- Chaikin Money Flow
- Chande Dynamic Momentum Index
- Chande Momentum Oscillator
- Commodity Channel Index (CCI)
D
E
G
H
I
K
L
M
- MACD
- McClellan Histogram
- McClellan Oscillator
- McGinley Dynamic
- Momentum
- Envelopes
- Moving Average Indicator
P
R
S
T
- T3 Average
- Trailing Stop loss Levels
- Trend Trigger Factor
- Triple Exponential Average (TRIX)
- Triple Exponential MA (TEMA)
- True Strength Index (TSI)
U
W
You can navigate these learn cfds chart indicators explained tutorials from the right navigation menu or using the above links.
RSI Indicator - Technical Analysis
MACD Indicator - Technical Analysis
CFDs Chart Indicators Technical Analysis
Most cfds technical indicators are displayed separately from the chart usually below the cfds chart. This is because these cfds chart indicators often use a different scale than that of the cfd price chart.
Other CFDs technical analysis indicators are shown on the chart itself, such as Moving Averages and Bollinger Bands - these are referred to as price overlays cfds chart indicators.
Some of the popular cfds chart indicators when it comes to cfds analysis are:
Moving Average (MA) cfds indicator - Using a variety of CFDs analysis studies, various types of cfds trading signals can be generated from the cfds charts using the moving averages. The Moving Average indicator indicates buy signals when prices rise above the moving average lines. Sell signals occur when price falls below the moving average lines. Another method to trade with moving averages is using the Moving Average crossover cfds trading signals.
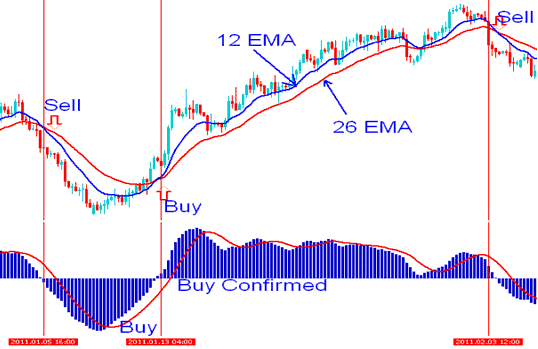
MACD indicator is one of the cfds trend following indicators, MACD indicator has a signal line that is used to generate a buy signal (above the MACD indicator center line) or a sell signal (below the MACD indicator center line).
Volume based cfds market analysis indicators are used to determine the momentum of cfds trends. High volume, especially near the bottom of the market can indicate the beginning of a new cfds trend while low volume might indicate ranging markets or sideways market movements.
Bollinger Bands indicator shows potential points where the market movements are likely to change. Technical analysis setups of this Bollinger Bands indicator that show sharp moves in price action tend to occur when the Bollinger Bands tighten (the Bollinger band squeeze). While prices that touch one of the outer Bollinger Band tends to go all the way to the other band. Bollinger Bands move in a particular direction up or down when there is a cfds trend.
CFDs Indicators MT4 - these indicators are some of the most commonly used technical indicators when it comes to daily CFDs technical analysis. To learn more about how to combine these cfds technical analysis indicators to form a cfds trading strategy navigate to the CFDs Strategies Lesson - CFDs Chart Indicators Discussed and learn how to come up with an Indicator Based CFDs Trading System.


