What is Doji Candlesticks in Bitcoin Trading?
What Does a Doji Candle Mean? - Doji Candlestick Meaning
Doji is a candlestick pattern with same opening and closing bitcoin price. There are various types of doji candlestick patterns that form on charts.
A doji candlestick is where bitcoin trading price on a cryptocurrency chart for a particular trading time period closes almost at the same bitcoin price. Doji candlesticks look like a cross, inverted cross or a + math sign.
The following example show various patterns of the doji candle-stick:
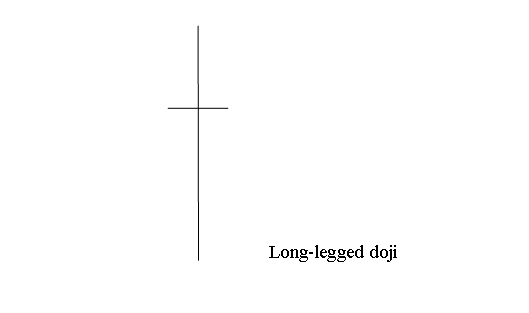
Long-legged doji candlestick has long upper & lower shadows with the opening and closing bitcoin price at the middle. When the Long-legged doji pops up on a Bitcoin chart it indicates indecision between cryptocurrency traders, buyer & the sellers.
Shown Below is an example screen shot image of the Long Legged
What is Doji Candles in Crypto Trading? -Technical Analysis of Doji Crypto Candlestick Pattern
Technical Analysis of Doji Crypto Candlestick Pattern
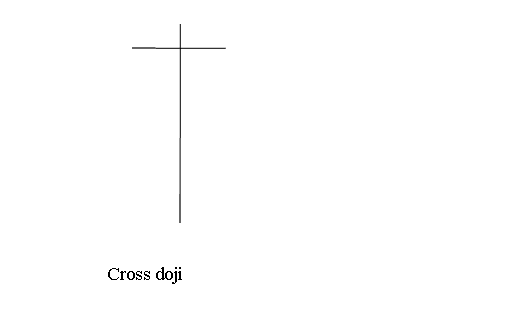
Cross doji bitcoin trading candlestick pattern has a long lower shadow & a short upper shadow & the open & close of the day is the same.
This cryptocurrency candlestick pattern appears at market turning points & warns of a possible bitcoin trend reversal in the Bitcoin. Below is as example of this Cross doji candlestick formation
Cross Doji Cryptocurrency Candlestick Pattern - Analysis of Doji Crypto Candlestick Pattern
Technical Analysis of Doji Crypto Candle Pattern
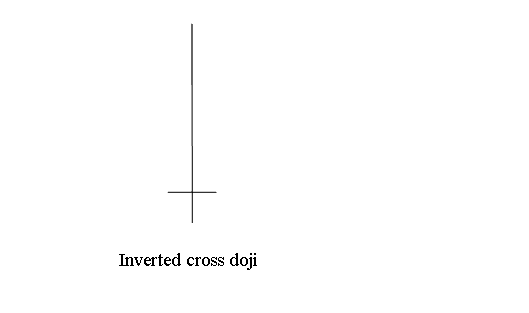
Inverted cross doji bitcoin trading candle pattern - candlesticks have a long upper shadow and a short lower shadow and the open and close is the same.
This reversal doji cryptocurrency candlestick pattern appears at market turning points & warns of a possible bitcoin trend reversal in the Bitcoin. Below is an example of this reversal doji bitcoin trading candlestick pattern
Inverted Cross doji Cryptocurrency Candlestick Pattern - Analysis of Doji Crypto Candlestick Pattern
Technical Analysis of Doji Crypto Candlestick Pattern - All doji cryptocurrency candles pattern show indecision in the Bitcoin Trading market this is because at the top the buyers were in control and at the bottom the sellers were in control but none could gain control and at the close of the btcusd trading market the bitcoin trading price closed unchanged at the same bitcoin trading price as the opening bitcoin trading price.
This doji cryptocurrency candlestick pattern shows that the overall bitcoin trading price movement for that day was zero pips or just a minimum range of 1-3 pips. Reading these candlesticks patterns need very small pip movement between the opening bitcoin price & closing bitcoin trading price.


