Reversal Candlestick BTCUSD Trading Patterns: Bearish Crypto Candle Patterns
Reversal Candle BTCUSD Trading Patterns: Bearish Crypto Candle Patterns
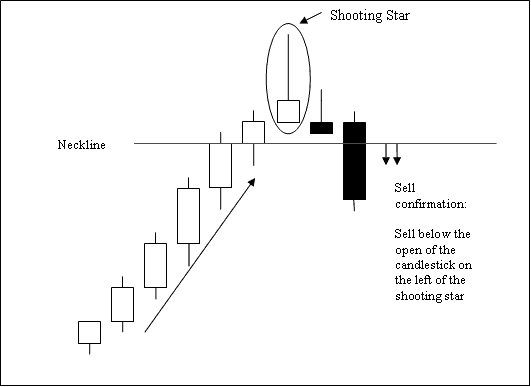
Shooting Star BTCUSD Candlesticks Pattern is a bearish reversal candlesticks pattern. It forms at the top of a cryptocurrency trend.
Shooting Star Bitcoin Candlestick Pattern occurs at the top of a up bitcoin trend where the open bitcoin price is the same as the low - and bitcoin price then rallied up but was pushed back down to close near the open.
Shooting Star Cryptocurrency Candlestick Pattern Reversal Candlestick Bitcoin Chart Patterns: Bearish Cryptocurrency Candlestick Patterns
Technical Analysis of Shooting Star BTCUSD Candles Patterns
A sell is confirmed when a candlestick closes below the neckline of this shooting star candlestick pattern, this is the opening of the candlestick on the left side of this cryptocurrency candlestick pattern. The neck line in this case is a support level.
Stop loss orders for the sell cryptocurrency trades should be placed a few pips above the highest bitcoin price on the recent high.
The Shooting Star candlestick is named so because at the top of an upward cryptocurrency trading market trend this cryptocurrency candle pattern looks like a shooting star up in the sky.


