Chart Timeframes
MT4 Bitcoin Chart Time Frames: Periodicity on Cryptocurrency Charts in MT4
Periodicity is commonly referred to as Bitcoin Chart Time Frames by many cryptocurrency traders. On the MT4 software.
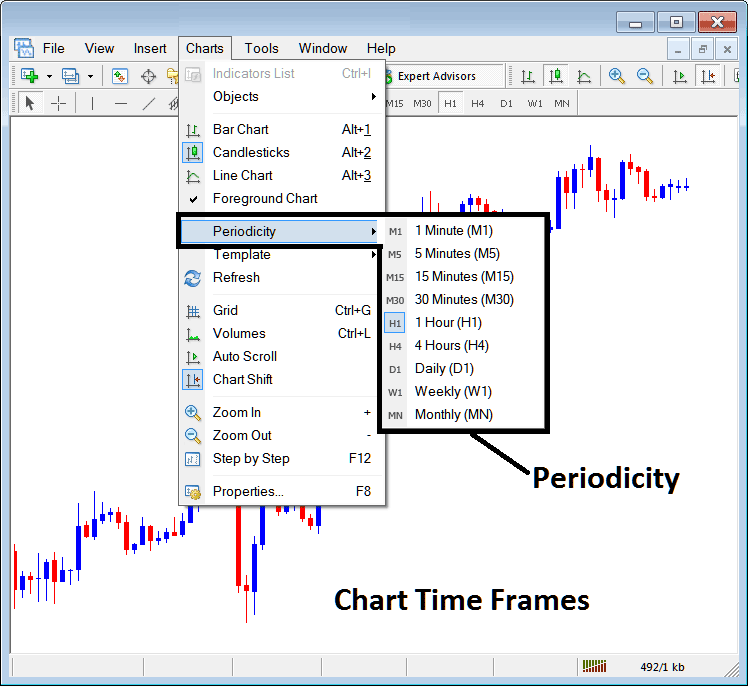
The button key below is used to select the periodicity or crypto chart time frame to trade with. This button can be accessed on the MT4 platform as shown below.
MT4 Bitcoin Chart Timeframe Bitcoin Charts
On the MT4 platform these crypto chart time frames are:
- 1 Minute chart Time-frame - M1
- 5 Min chart Time-frame - M5
- 15 Minutes Chart Timeframe - M15
- 30 Minutes Chart Time-frame - M30
- 1 H chart Time-frame - H1
- 4 Hours Chart Time Frame - H4
- Daily Chart Time-frame - D1
- Weekly Chart Time-frame - W1
- Monthly Chart Timeframe - MN
How to Know Which Bitcoin Chart Timeframe You are Using
A common question especially if you are new to bitcoin trading would be how to identify which crypto chart time frame you are using on your MT4 software:
There are various methods of knowing which MetaTrader 4 crypto chart time frame you are using as Shown below:
Use the above Menu as Shown above
In the above cryptocurrency trading example once you select the periodicity button under the charts menu, then the list of bitcoin trading MT4 chart time frames is shown and the crypto chart time frame that is currently selected, the one that you are using will be highlighted with a different color, on our above example this is the 1 Hour(H1) crypto chart time frame, whose Icon on the left is highlighted in light blue.
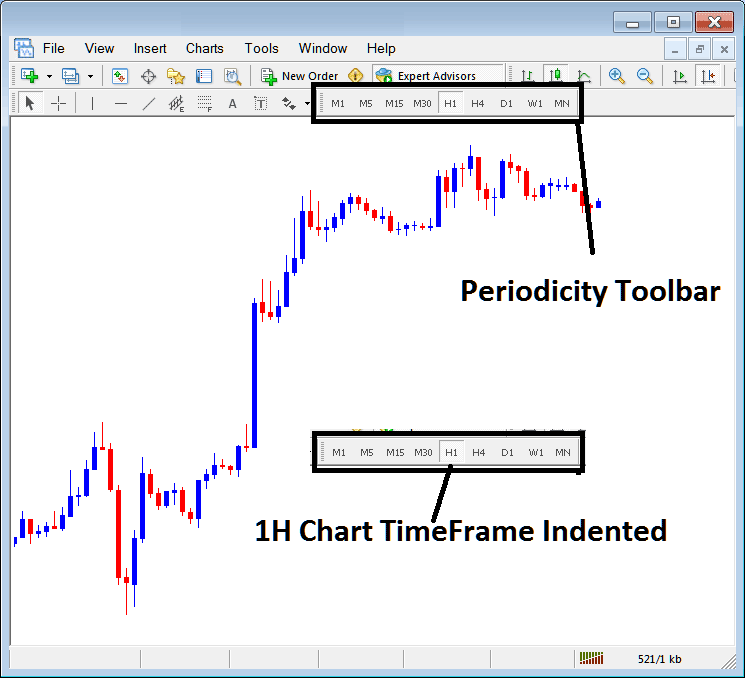
MT4 Bitcoin Chart Change Chart Timeframe - How to Change MT4 Bitcoin Chart Time-frame
This MT4 periodicity toolbar is by default located at the top of the MT4 platform and has all the crypto chart time frames marked as shown below. The crypto chart timeframe that a trader is using will be marked differently from the other crypto chart time frames, the selected crypto chart time frame will be "indented" as shown below:
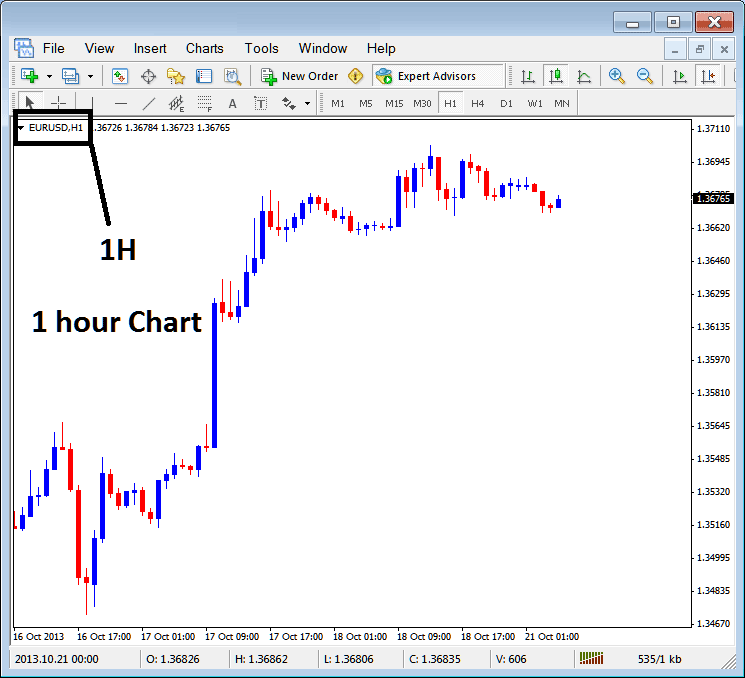
Use the information displayed at the top left corner to get MT4 Bitcoin Chart Time Frame
At the top left corner of the bitcoin trading MT4 chart, MetaTrader 4 crypto chart time frame is displayed as shown below:
1 H MetaTrader 4 Bitcoin Chart Time-frame
15 Min MT4 Bitcoin Chart Time-frame
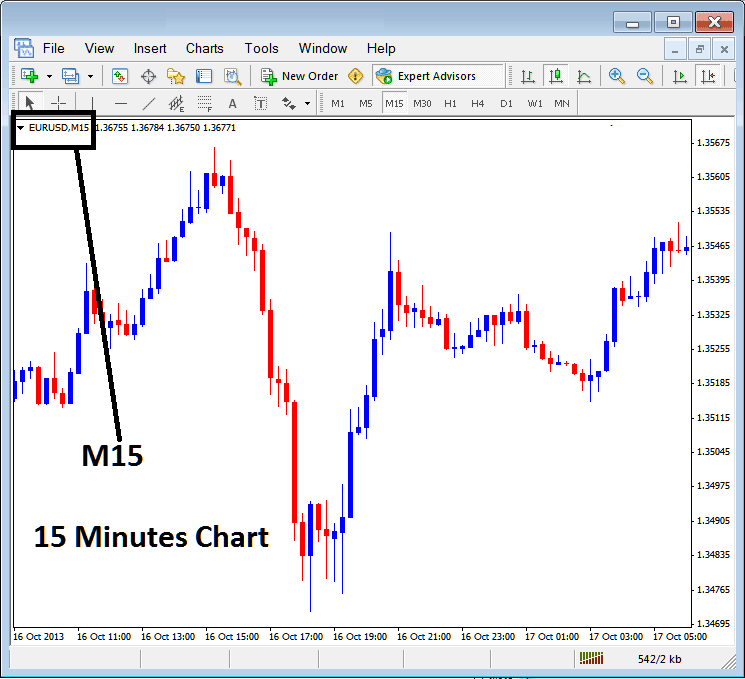
When you open a cryptocurrency chart you can then use the above three methods to know which periodicity bitcoin trading chart timeframe you're trading with.
You can also use the tabs, if you are trading many cryptocurrency charts. To view this tab, Go to "View Menu" then Select "Charts Bar". The following MT4 bar will appear that you can use to navigate and it indicates the btcusd chart as well as the bitcoin trading chart time-frame.
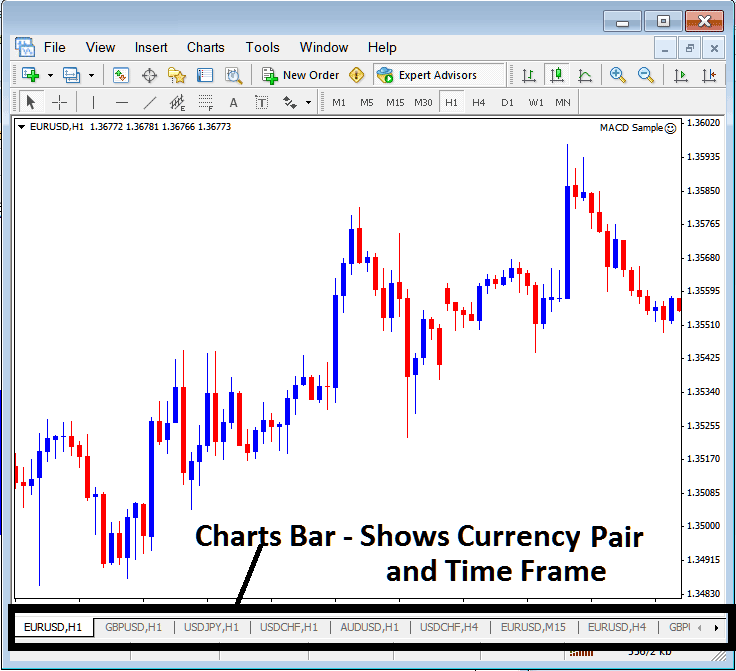
Navigation tabs in MetaTrader 4 work space.


