Bulls Power Bitcoin Analysis & Bulls Power Trade Signals
Developed by Alexander Elder
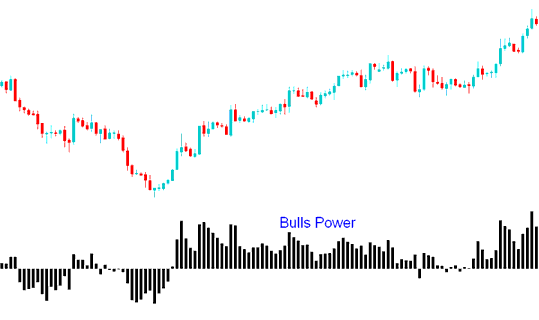
Bulls Power measures the strength of buyers in the market, evaluating the balance of power between bulls and bears.
This btcusd indicator seeks to determine if an upward bitcoin trend will persist or if the price has hit a threshold indicating a potential reversal.
Calculation
A Bitcoin Price bar includes 4 details: the Opening, Closing, Highest, and Lowest points of the btcusd crypto price bar.
Each Bitcoin price bar either closes higher or lower than the preceding bitcoin price bar.
The highest BTCUSD price shows the bulls' max strength in that cryptocurrency period.
The lowest price for BTCUSD will reflect the maximum strength of the bears within a specified BTCUSD price period.
This Indicator uses the High of the bitcoin price & a MA (Exponential Moving Average)
The moving average shows the balance between sellers and buyers. It spans a certain bitcoin price time.
Therefore:
Bulls Power = High Bitcoin Price - EMA

Bulls Power
Bitcoin Analysis and How to Generate Signals
Buy Signal
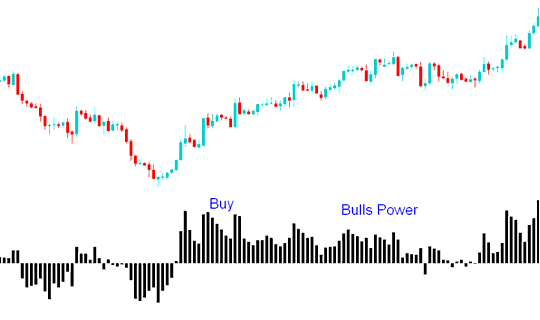
A buy signal for cryptocurrency is generated when the Bulls Power oscillator exceeds the zero line.
In an up BTCUSD trend, the high rises above the Exponential Moving Average. Bulls Power goes over zero, and the histogram stays above the zero line.

Exit Trade Signal
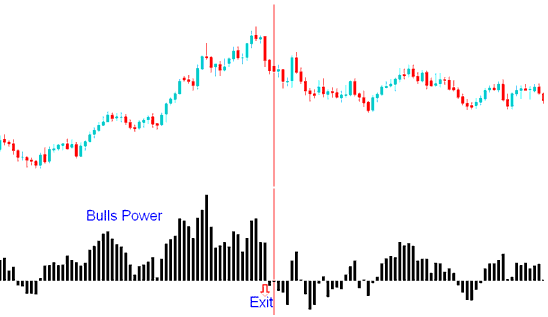
If the high drops below the Exponential Moving Average, Bitcoin prices begin to fall. The Bulls Power histogram dips under the zero line.

The Triple Screen method/technique for this trading indicator suggests identifying the bitcoin price trend on a higher chart interval (like daily time-frame) and applying the bulls powers on a lower chart interval (like hourly chart time-frame). Signals are traded and transacted according to the indicator but only in direction of the long term bitcoin trend in the higher time frame.
Learn More Lessons and Tutorials & Courses:
- How Can You Set Stop Loss BTC USD Order & Take Profit BTC USD Order in MT4 Software Platform?
- Types of Reversal Candle Chart Patterns Applicable to BTCUSD
- Using the RSI 50 Midpoint to Trade BTC/USD Pairs
- Utilizing Fibonacci Pullback Levels in Trending and Non-Trending Markets
- Bitcoin Trading: Include a Unique MT4 BTCUSD Indicator in MetaTrader 4 Software
- Bitcoin Trading Strategies for RSI Swing Failures
- Best BTC USD Indicator Combination Bull Power BTC/USD MT4 Technical Indicator
- How to Place BTC USD Stop Losses Using Bitcoin Trendlines
- What is BTC/USD & How Does it Work?
- A Practical Example Demonstration of Trendline Technical Analysis in Application
